Time Bridges
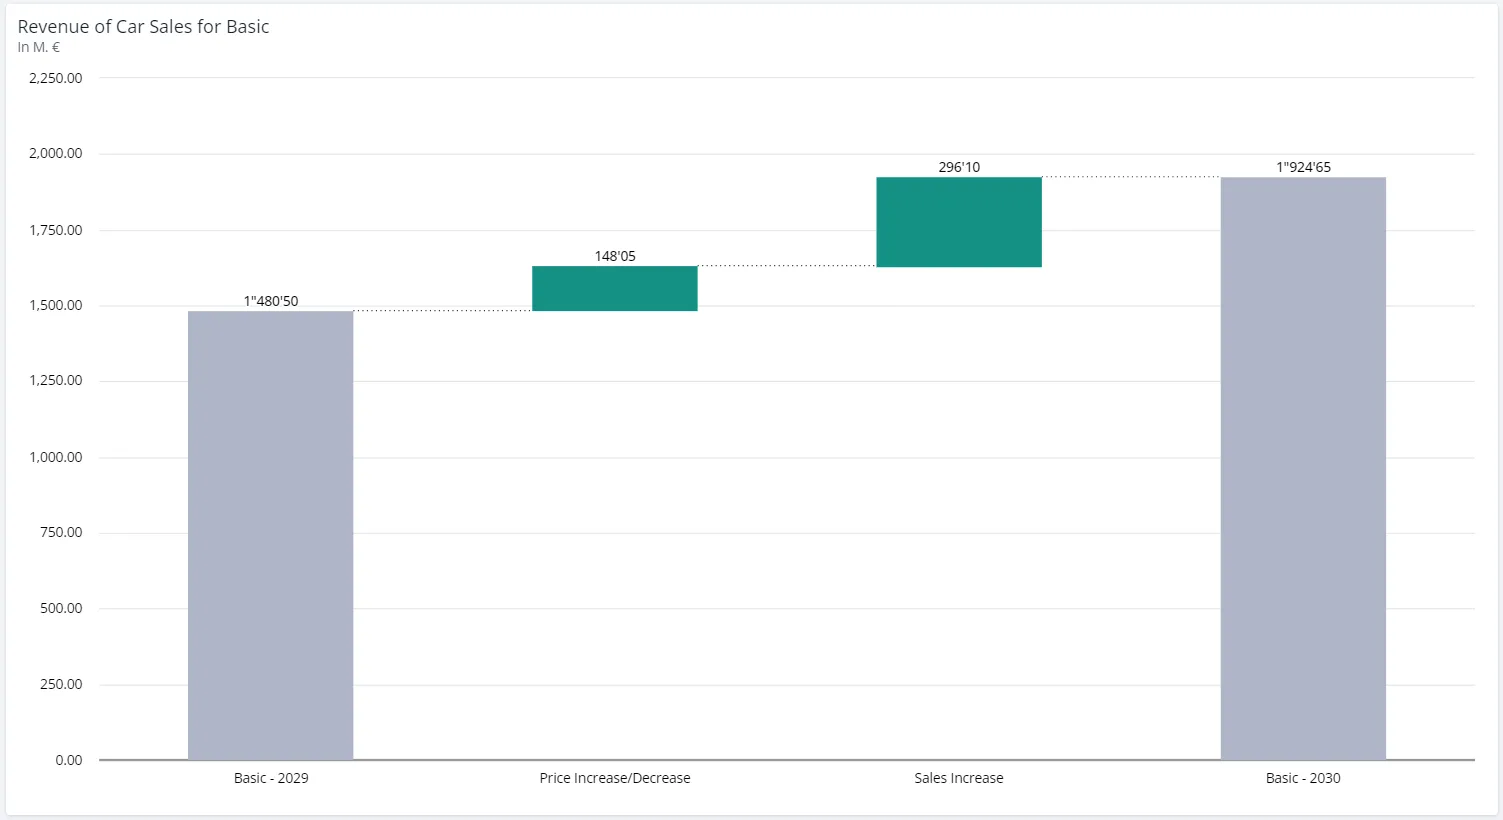
A time bridge explains the change between two or more points in time within one scenario. It steps from the earlier period’s value to the later one through the effects of the assumptions and line-items in between.
What it is
A time bridge answers “why is this year different from last year”. Its counterpart, the scenario bridge, answers “why is this scenario different from that one” within a single period. Both use the staircase the chart editor calls a waterfall chart.
When to use it
- You want to explain year-over-year movement to someone who only sees the two totals.
- You want to separate what the plan assumed from what the model itself contributed.
- You want to show the effects of several years accumulating, rather than one step at a time.
Use a scenario bridge instead when the two values are two scenarios in the same period.
Configuration
Create the bridge
- Click the Chart button in the upper right corner of a worksheet.
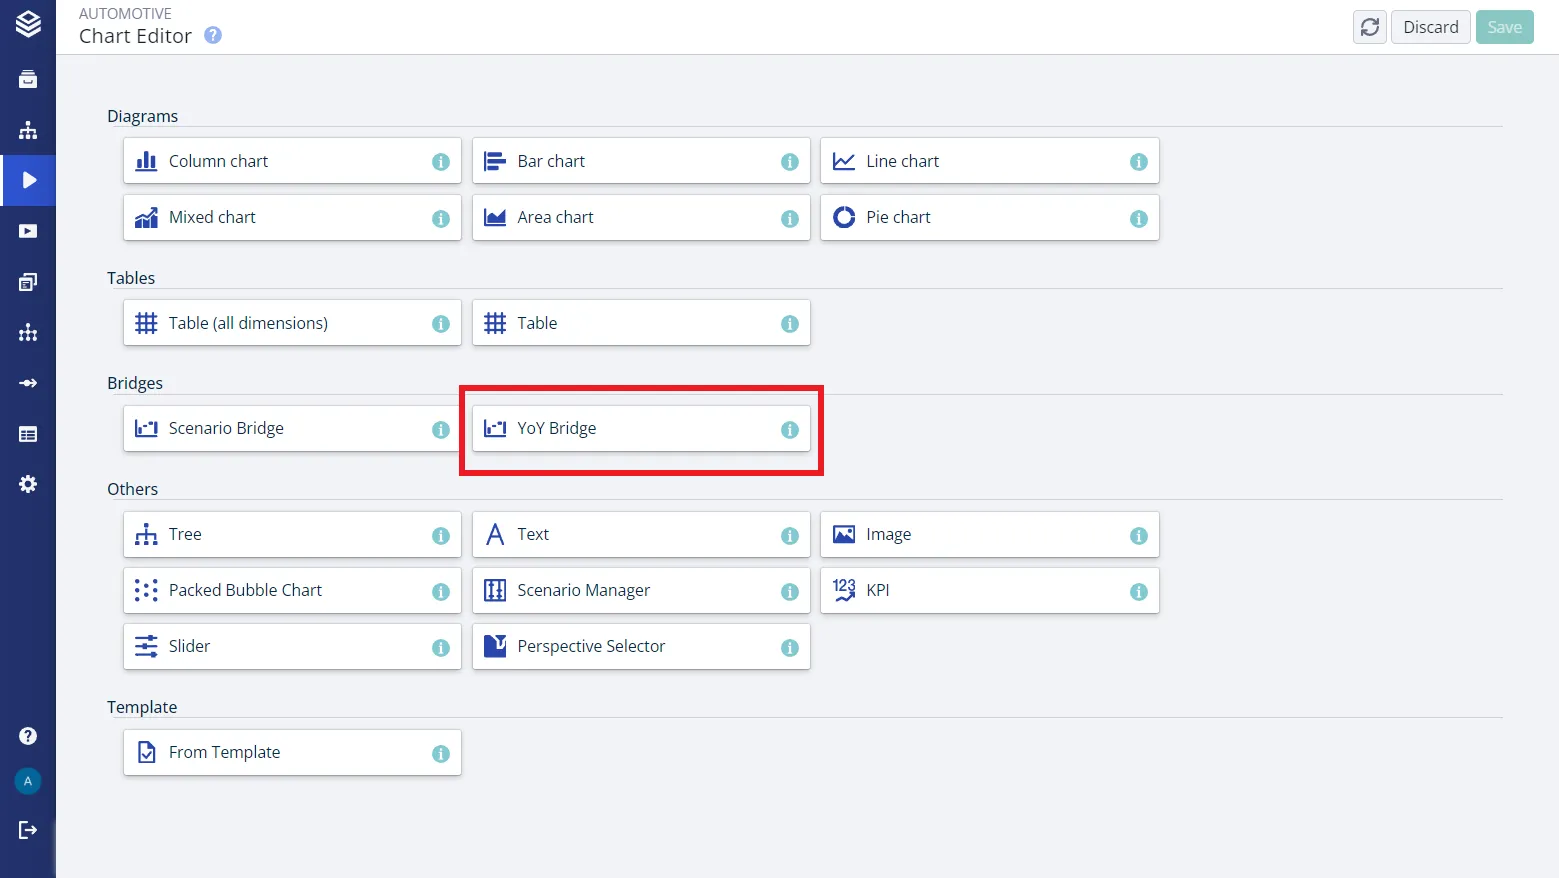
- Select Time Bridge in the chart selection.
- Select the node that should be the base of the data.
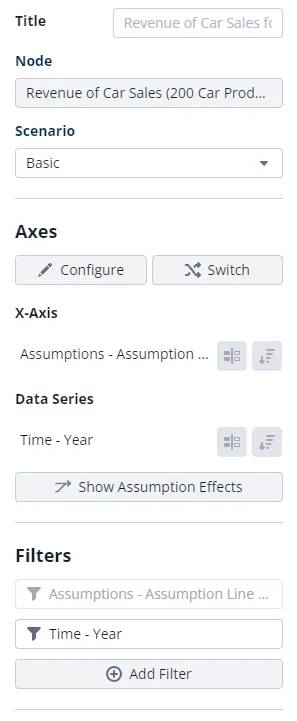
- Select a scenario and the time level to bridge across, for example Year.
- Select the periods to compare.
- Select what the difference should be broken down by. Assumptions is preselected.
Change it afterwards
| Setting | What it does |
|---|---|
| Node | The node whose data the bridge shows. Change it in the chart editor at any time. |
| Scenario | The scenario the change is analyzed within. A time bridge works inside one scenario. |
| Configure Axes | Puts line-items or assumptions on the axis. A new bridge carries the time level you chose as the data series, and the breakdown you chose, Assumptions by default, on the x-axis. |
| Period Selection | Which periods the bridge spans. Set through the Time filter in the chart editor. |
A bridge spans the periods you picked when creating it. Change them afterwards through the Time filter:
- Selecting two non-adjacent periods, for example 2017 and 2020, produces a bridge with the summed-up effects of the years in between.
- Selecting a single period makes the bridge use the previous period as its reference point automatically.
You can switch an existing chart between the two bridge types with Bridge between periods in Bridge Settings.
Add intermediate sums
A bridge can show intermediate sums as gray bars, so a long chain of effects is broken up by the running total at chosen points.
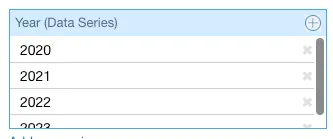
To show 2020, 2021, 2022 and 2023 as intermediate sums in this chart:
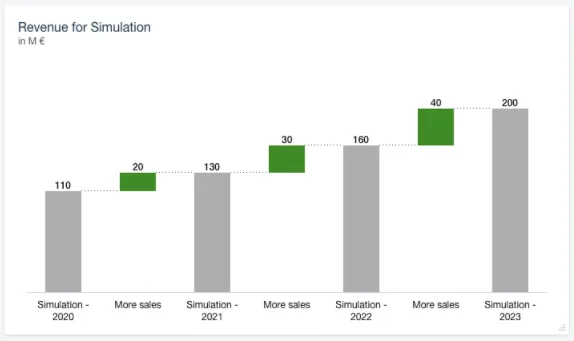
Add them as years in the sidebar:
How the effects are calculated
Assumptions come in two kinds, and the difference decides what a time bridge shows. An assumption with a base effect carries its adjustment into the following years. One without a base effect is a one-time adjustment that does not.
Take the node Revenue.
Assumptions without a base effect, each year adjusted on its own:
| 2017 | 2018 | 2019 | |
|---|---|---|---|
| Assumption 1 (no base effect) | +10 | +15 | +20 |
| Assumption 2 (no base effect) | - | +20 | - |
| Revenue | 10 | 35 | 20 |
Assumptions with a base effect, where the previous year carries forward:
| 2017 | 2018 | 2019 | |
|---|---|---|---|
| Revenue PY | - | 20 | 35 |
| Assumption 3 (with base effect) | +10 | - | - |
| Assumption 4 (with base effect) | +10 | +15 | +20 |
| Revenue | 20 | 35 | 55 |
Valsight determines the individual effect of every assumption active in the selected scenario between the two periods being viewed. For the data above, a time bridge for 17/18 or 18/19 shows:
| Time Effect 17/18 | Time Effect 18/19 | |
|---|---|---|
| Assumption 1 (no base effect) | +5 | +5 |
| Assumption 2 (no base effect) | +20 | -20 |
| Assumption 3 (with base effect) | 0 | 0 |
| Assumption 4 (with base effect) | +15 | +20 |
Assumption 3 contributes nothing to either step: its adjustment landed in 2017 and, because it has a base effect, it is carried in both years of each comparison and cancels out.
Good to know
- A base effect can make an assumption disappear from the bridge. An assumption whose adjustment is already carried in both periods nets to zero, as Assumption 3 does above. That is correct, not a missing effect.
- A one-time assumption shows up twice, with opposite signs. Assumption 2 adds +20 in 17/18 and -20 in 18/19, because the adjustment arrives and then goes away again.
- Two non-adjacent periods sum the years between them. Selecting 2017 and 2020 does not skip 2018 and 2019, it accumulates them.
- The model’s own contribution is separate from the assumptions. It arrives as a single data effects block, which can be split per node or grouped. See Data Effects Display in Bridge.
- Assumptions can explain themselves on hover. Give an assumption a description and switch on Show descriptions in tooltips. See Showing assumption descriptions.
Related
- Data Effects Display in Bridge: splitting the model’s own contribution out of its single block.
- Scenario Bridges: the same staircase, explaining a difference between scenarios.
- Assumption Effects: how each effect is derived, and how to show descriptions on hover.
- Grouping Assumption Effects: combine the line-items of one assumption into a single bar.