Default Scale Settings in Nodes
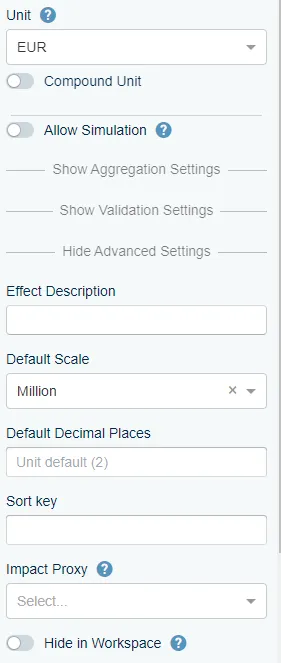
A node’s Default Scale sets the scale its numbers are displayed at, on the node itself. Every chart that shows the node picks it up, so you do not have to rescale each chart by hand.
What it is
Scale can be set in two places, and they work at different levels:
| Where | Scope |
|---|---|
| Scales and digits in the chart editor | That one chart, and one scale for the whole axis. |
| Default Scale in a node’s advanced settings | Every chart that displays that node, per node. |
The per-chart scale is a single setting for everything on the axis, which is the source of the problem below. The node setting is per node, so nodes of very different magnitudes can each be formatted correctly in the same chart.
When to use it
- Large numbers come out unformatted or too wide to read.
- Rescaling the chart fixes the large numbers but rounds the small ones to zero.
- The same node is charted in several places and you want its formatting consistent everywhere.
Configuration
- Open the model the node lives in.
- Select the node and click Show Advanced Settings.
- Set Default Scale.
Good to know
-
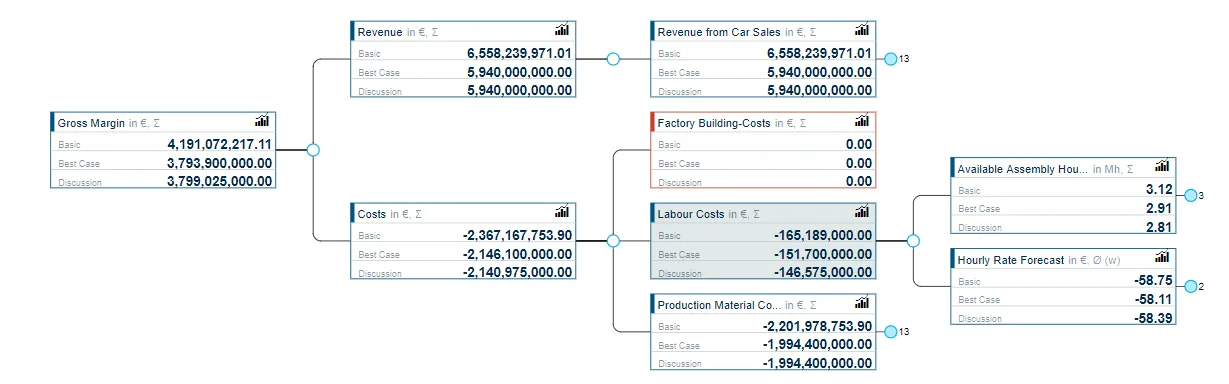
Rescaling the chart is the trap. Raising the scale in the chart editor applies to the whole axis, so the small values on it get rounded to 0 and disappear. Here the large numbers are unformatted and the chart-level scale cannot fix both at once:
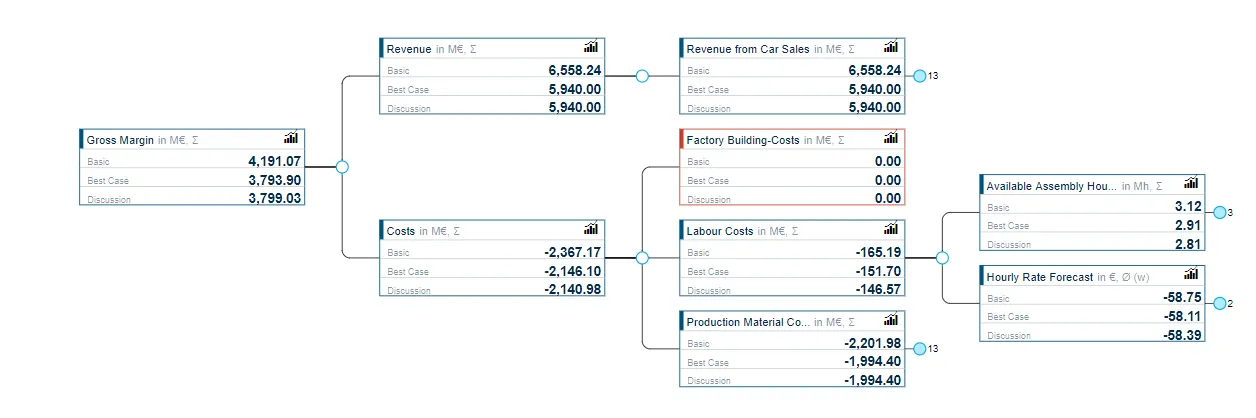
Setting Default Scale per node formats each node on its own terms:
-
It is a display setting. The stored values do not change, only how they are shown.
-
A model tree is where this shows up most. Trees put nodes of very different magnitudes side by side, so a single chart-level scale rarely suits all of them. See Model Tree.
Related
- Formatting Charts: the per-chart scale, under Scales and axes.
- Model Tree: the chart type where mixed magnitudes are most common.
- Advanced Node Settings: the other settings on a node.