Responsive Chart Text Size
Responsive chart text sizing scales the text in your charts to the size of the window, so a sheet stays readable on a laptop and on a large display without being reformatted by hand.
What it is
When it is on, fixed breakpoints scale the text of:
- chart labels and axis labels
- chart titles and subtitles
- table text
- KPI tile fonts
- text tile headings and body text
- slider labels, assumption titles and before/after values
| Window width | Font scaling |
|---|---|
| Small, up to 999px | Compact text |
| Medium, 1000px to 1800px | Standard text |
| Large, 1801px to 3000px | Enlarged text |
| Extra large, above 3000px | Maximized text |
When it is off, charts keep their original font sizes and layout.
When to use it
- The same worksheet is opened on screens of very different sizes.
- You present from a large display but build on a laptop.
- Table text or KPI tiles are hard to read at some window sizes.
Configuration
It can be set at two levels, and the workspace setting wins.
Instance level, an admin setting that becomes the default for all new workspaces:
- Go to Settings > Instance Settings.
- Find Responsive Chart Text Size.
- Choose On or Off. This applies only to workspaces set to Instance Default, new ones included. A workspace that has never been set follows Off rather than the instance setting, so switching the instance setting on does not on its own change existing workspaces. Off is the instance default.
Workspace level, which overrides the instance default:
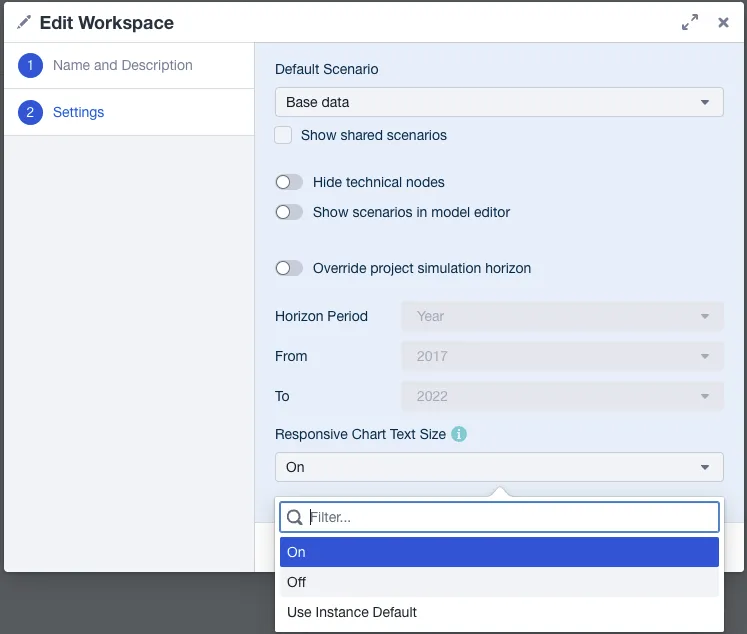
- Open the Workspace Settings.
- Find Responsive Chart Text Size.
- Choose Instance Default to inherit, On to force it on for this workspace, or Off to force it off.
Good to know
- Existing workspaces are unaffected. Turning the instance setting on changes new workspaces and those set to Instance Default, not workspaces that already carry an explicit On or Off.
- The breakpoints are fixed. You choose whether text scales, not how much, and there are four steps rather than a smooth scale.
- It needs admin rights at instance level. A user can only change their own workspace.
Related
- Formatting Charts: the other formatting options, including per data series styling.
- Styling Data Series, Columns and Rows: set font color, style and orientation per data series.