Chart Filter
Chart filters are the third level of filters available in a workspace.
Chart filters can be used to restrict the view in your chart so that they only display a subset of data.
Filters can either be multi-select or single-select filters. Each level that is selected as one of the axes will automatically add a multi-select filter to your chart that contains all values by default.
To limit the number of values on your axis, you can restrict the filter. You can always add a new filter by pressing the “Add Filter” button in the ‘Manage Filters’ dialog and selecting the dimension and level for the new filter.
When you select the dimension and level for a new filter, the level picker includes a search box at the top. Start typing to narrow the list: it matches dimension names first, so matching a dimension keeps all of its levels, and otherwise matches level names. Matching is case-insensitive, and dimensions with no matching levels are hidden.
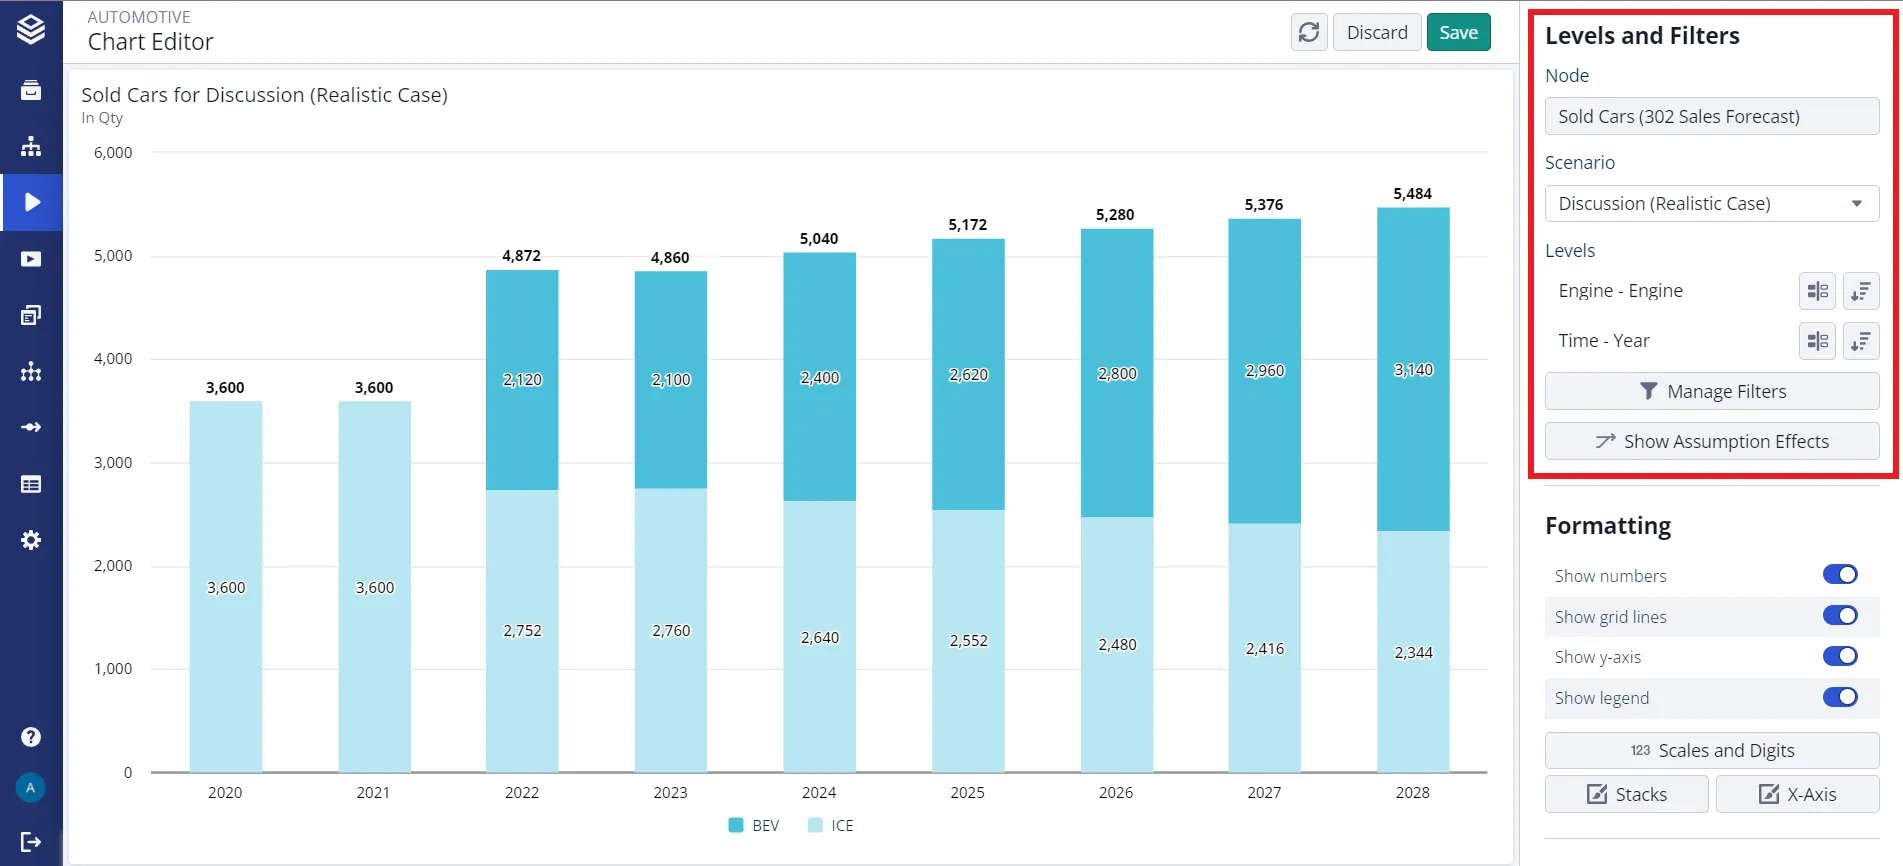
Chart filters are limited by the applied workspace and worksheet filters.