Overlapping Data Labels
Where data labels overlap in a chart, not all values can be shown. The values are still correct, only some of the labels are dropped.
Which label wins
In area charts and line charts, the sort order of the nodes decides which label wins. If a chart shows two nodes and node B is sorted above node A, the chart prioritizes node B’s label, so where labels collide only node B’s is shown.
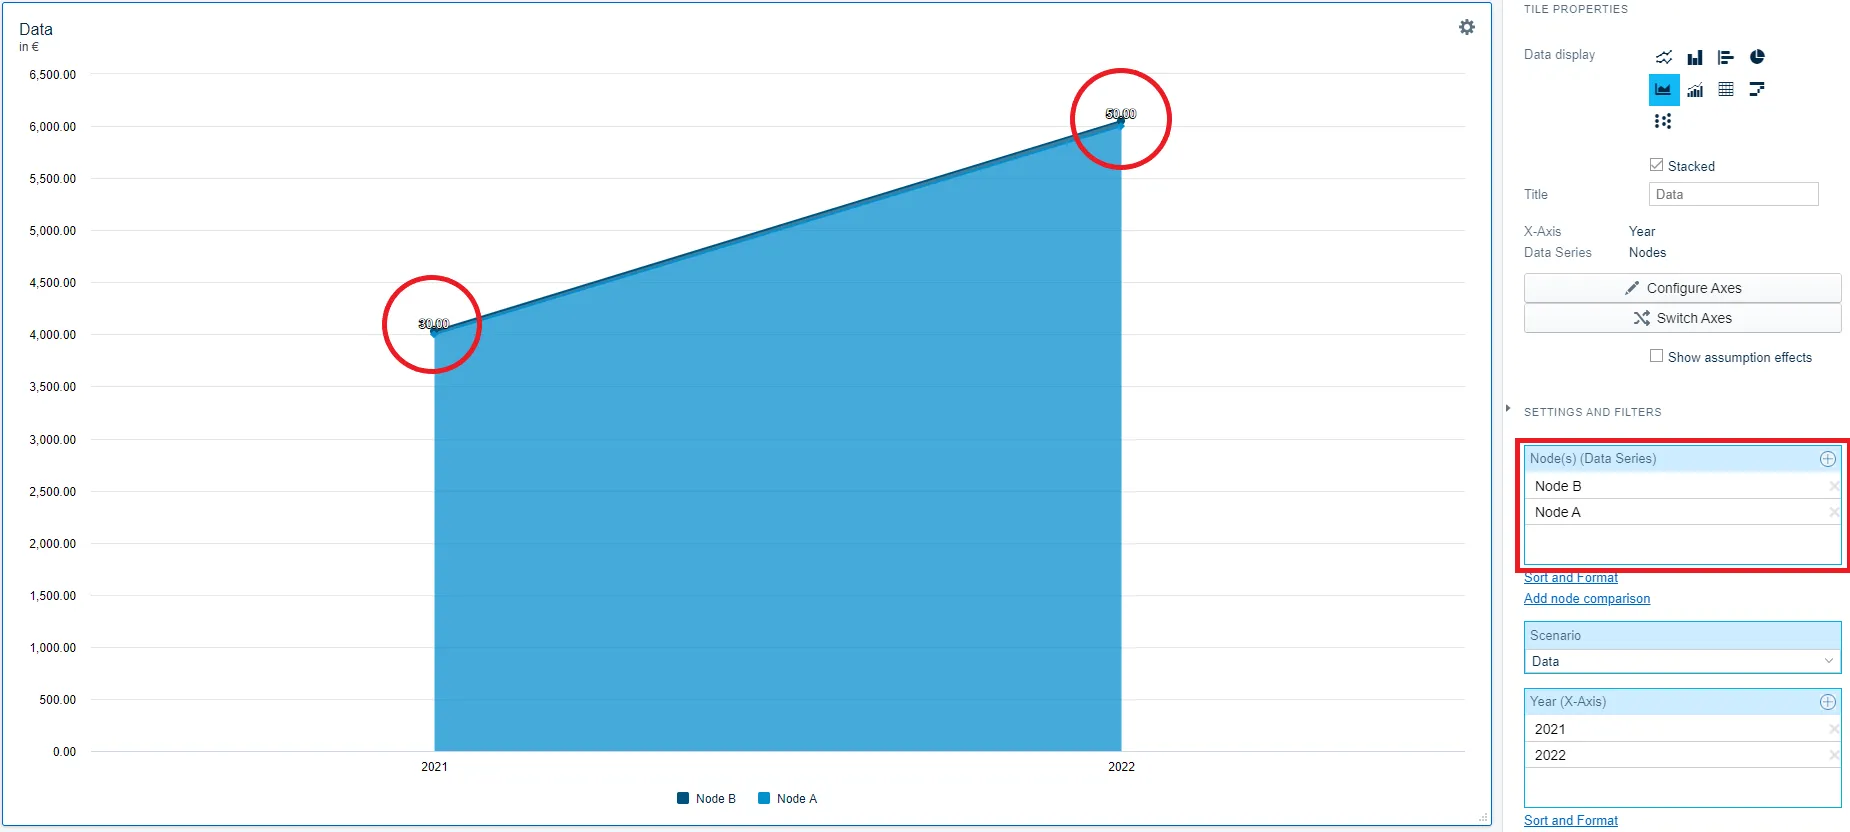
This does not mean the numbers are wrong.
Reorder the nodes
To change the priority, reorder the nodes: in the Axes section of the chart editor, click the sort button next to the level the nodes sit on and drag them into the order you want. See Sorting Level Values.
Show a total instead
The other route is stack totals. Below, the Combined sum option shows the total of both nodes instead of the two colliding labels.
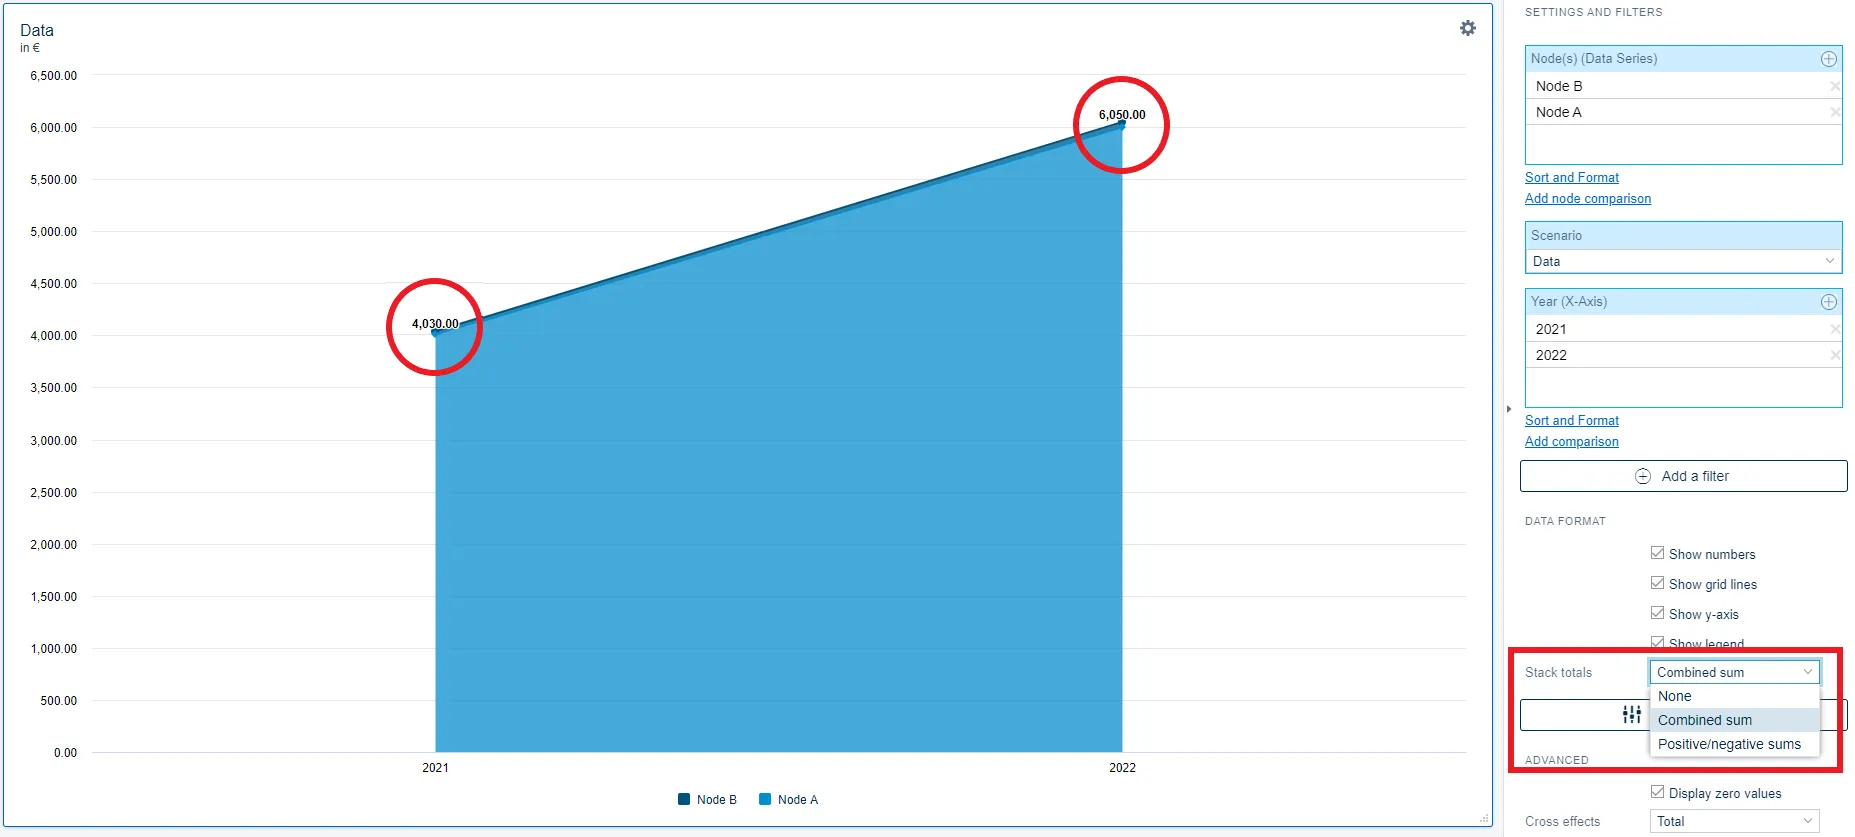
Data behind both examples:
| Node | 2021 | 2022 |
|---|---|---|
| A | 4000 | 6000 |
| B | 30 | 50 |
Related
- Sorting Level Values: the order that decides which label wins.
- Stacking and Stack Totals: stack the data series and label the total of each stack.
- Styling Data Series, Columns and Rows: hide the values of one data series entirely.