Perspective Selector
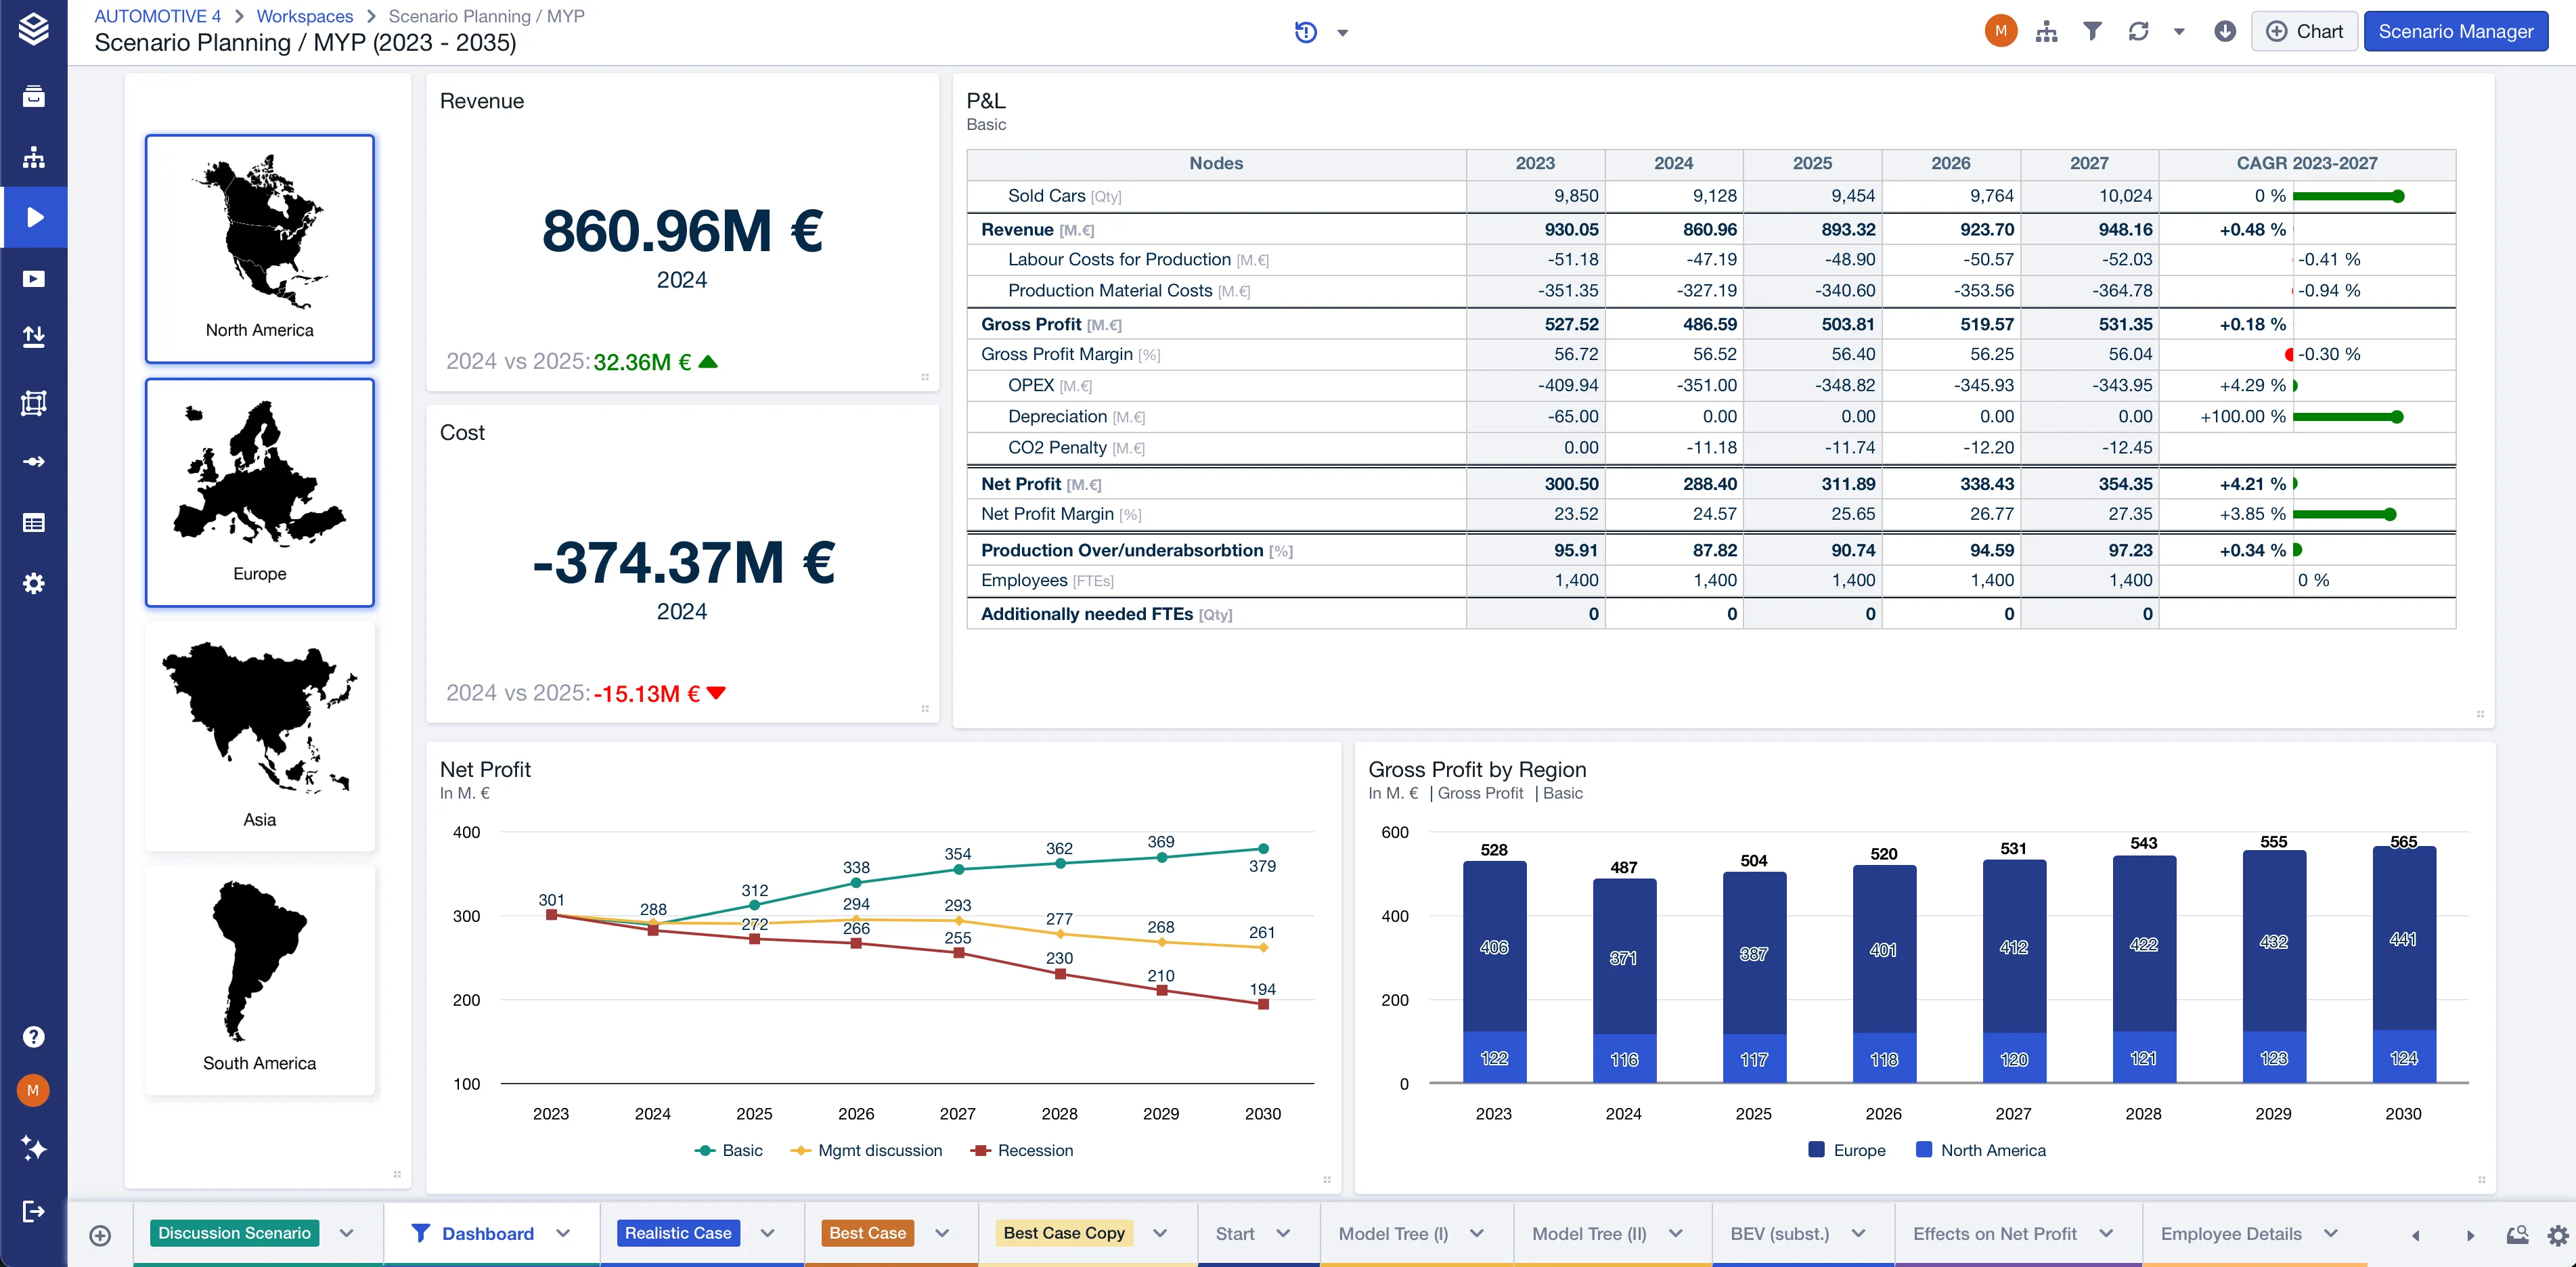
The Perspective Selector is a new interactive chart type introduced for enhancing presentations in Valsight. Its primary purpose is to enable decision-makers and presenters to apply predefined filters across sheets in a visually appealing, intuitive way, without switching to edit mode or accessing complex filter configurations.
Why it matters
- Seamless Presentation Mode: Quickly adjust views during discussions.
- No Technical Know-How Required: Apply complex filters via a single click.
- Visual Storytelling: Each perspective can include images and tailored filter sets.
This functionality significantly simplifies scenario exploration and data storytelling during live meetings.
Navigating to the feature
1. Creating a Perspective Selector
Prerequisite: an administrator must switch on the global setting
featureFlags.use.perspectives. It is off by default, so until it is enabled the Perspective Selector chart type does not appear under Others in the chart wizard.
- Open a Sheet within your workspace.
- Click on “+ Chart” to open the chart wizard.
- Under the “Others” section, find and select the “Perspective Selector” chart type.
2. Configuring each perspective
The Title field at the top of the dialog sets the tile’s title.
A Perspective consists of a “Name”, an “Image” and “Filters”. All properties are optional and can be configured in every combination.
-
Perspective Name: The name is shown on the perspective tile, below the image if there is one, and as a tooltip.
-
Add Image (optional):
- Upload PNG, JPG or GIF (max 2.5MB, max width 1920px).
- If no image is provided, the name will be shown in the tile.
-
Add Filters:
- Select filter dimensions and values.
- A perspective cannot hold a filter with all values of a level selected: that is rejected with ‘Perspectives do not support filters where all level values are selected. Please adjust or remove the filter.’ Deselect at least one value, or remove the filter. A filter with no values selected is refused as well.
- Use the “Manage filters” button to edit filters.
- Applied filters are shown as tags in the dialog.
3. Interacting with the tile
Once created:
-
Each perspective appears as a clickable button on the tile.
-
Clicking a button applies the associated filter set. This needs edit rights on the workspace: a read-only viewer cannot switch perspective at all.
-
The tile header shows Edit and Settings (⚙️) icons on hover.
-
The tile can also be:
- Moved
- Duplicated
- Saved as a template (like other charts)
To rename the tile, use “Edit Title” in the cogwheel menu.
Managing & customizing
Admin/User rights
- No per-user customization: Perspectives are shared and synced across users. Switching perspective is a change to the workspace, not a personal view, so it changes what every other user of that workspace sees.
- Switching needs edit rights. Someone with read-only access to the workspace cannot click a perspective button, which matters when a presentation is opened by an audience rather than by its author.
- Edits in configuration dialogs are locked while someone is editing to avoid conflicts. A perspective switch made while another user holds that lock does not go through.
Tile customization
-
Perspectives tile supports standard layout behaviors:
- Can be rearranged and resized.
- The layout follows the tile’s shape on its own: resize it wider than it is tall and the perspectives lay out in a row, taller than wide and they stack in a column. There is nothing to configure. The tile scrolls, in either direction, when they do not fit.
- Combining multiple perspective tiles to impact a worksheet is also possible.
Filter behavior
-
Perspective Filters Logic:
- Within one perspective: INTERSECTION. Filters on different levels are combined, so only data matching all of them is shown. Within a single level, the values you select are combined as a union.
- Across perspectives: UNION per level. Each tile button toggles independently, so several perspectives can be active at the same time, and every active perspective on the sheet contributes its values.
- Combined with worksheet and chart filters: INTERSECTION.
-
No changes to:
- Sheet-level filters
- Filter conflict detection
- Chart subtitles (Perspective filters won’t appear here)
Perspectives are limited by the applied workspace filters, worksheet filters and chart filters.
Limitations
- In presentation mode, Perspective Selectors are shown but read-only. The tiles display the perspective that was active when the presentation was captured, and clicking a tile does not change the filter.
- This feature requires CORPORATE or ENTERPRISE licenses.
Example use case
Imagine a boardroom slide where different departments (Sales, Marketing, Finance) need custom views. With the Perspective Selector:
- Each department has a pre-defined button.
- During the meeting, click a button to instantly shift the view to that department’s filters.
- Presentations stay clean, contextual, and responsive without edit interruptions.