Y-Axis Breaks in Charts
A Y-axis break inserts a gap into the value axis so charts with large deviations or wide gaps in scale stay readable. Instead of small bars or numbers being squashed by a few very large values, you can “cut out” a range of the axis and bring all data points into a comfortable viewing range.
What it is
Y-axis breaks are configured per chart in the Chart Editor, under Scales and Digits.
You define a single break by setting the range to cut out (From–To) and how large the remaining visual gap should be (Breakpoint size). On save, the chart renders the break at that position, and all data above and below the break is drawn at a readable scale.
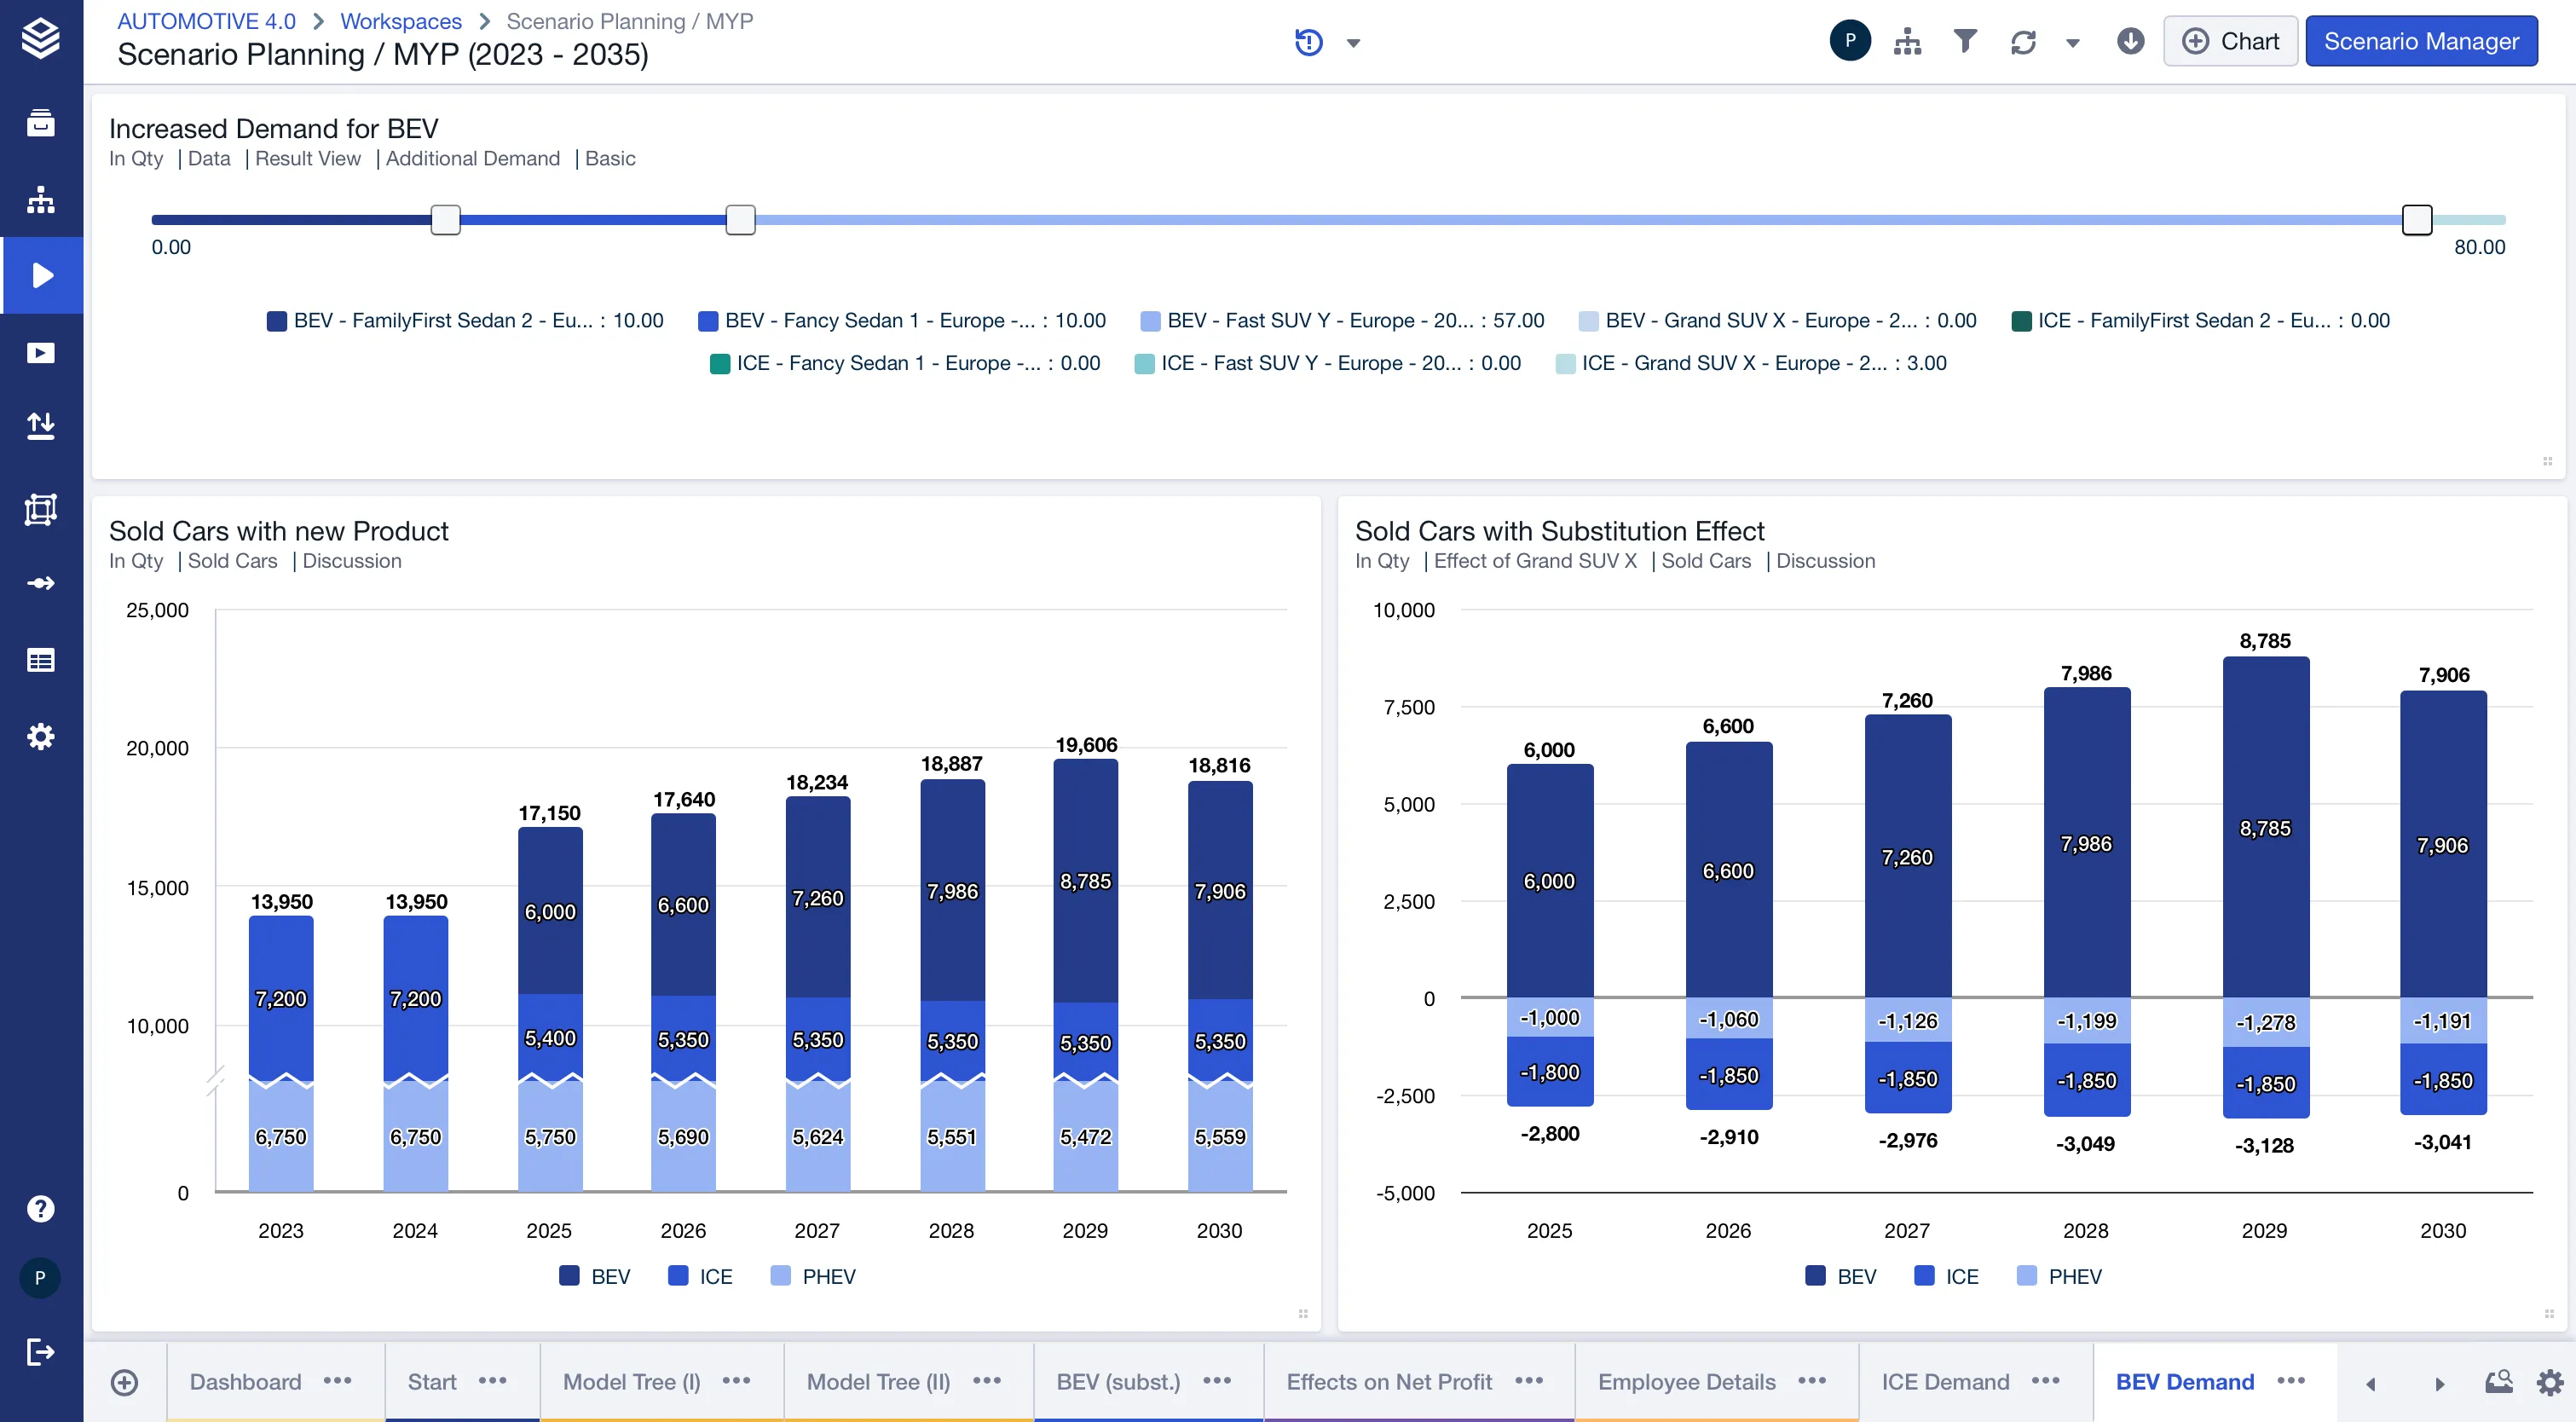
When to use it
- When a few very large values flatten the rest of the chart and make smaller bars or lines hard to read
- When there is a wide, empty gap in your value range that wastes vertical space
- When presenting in boardroom settings, where every bar and number needs to be clearly legible
Configuration
- Open the chart in the Chart Editor and go to Scales and Digits.
- Under Settings, below Max Value, turn on the Show Y-Axis Breaks toggle (off by default).
- The break settings appear. Configure them as described below.
- Save the chart. The break is drawn on the Y-axis.
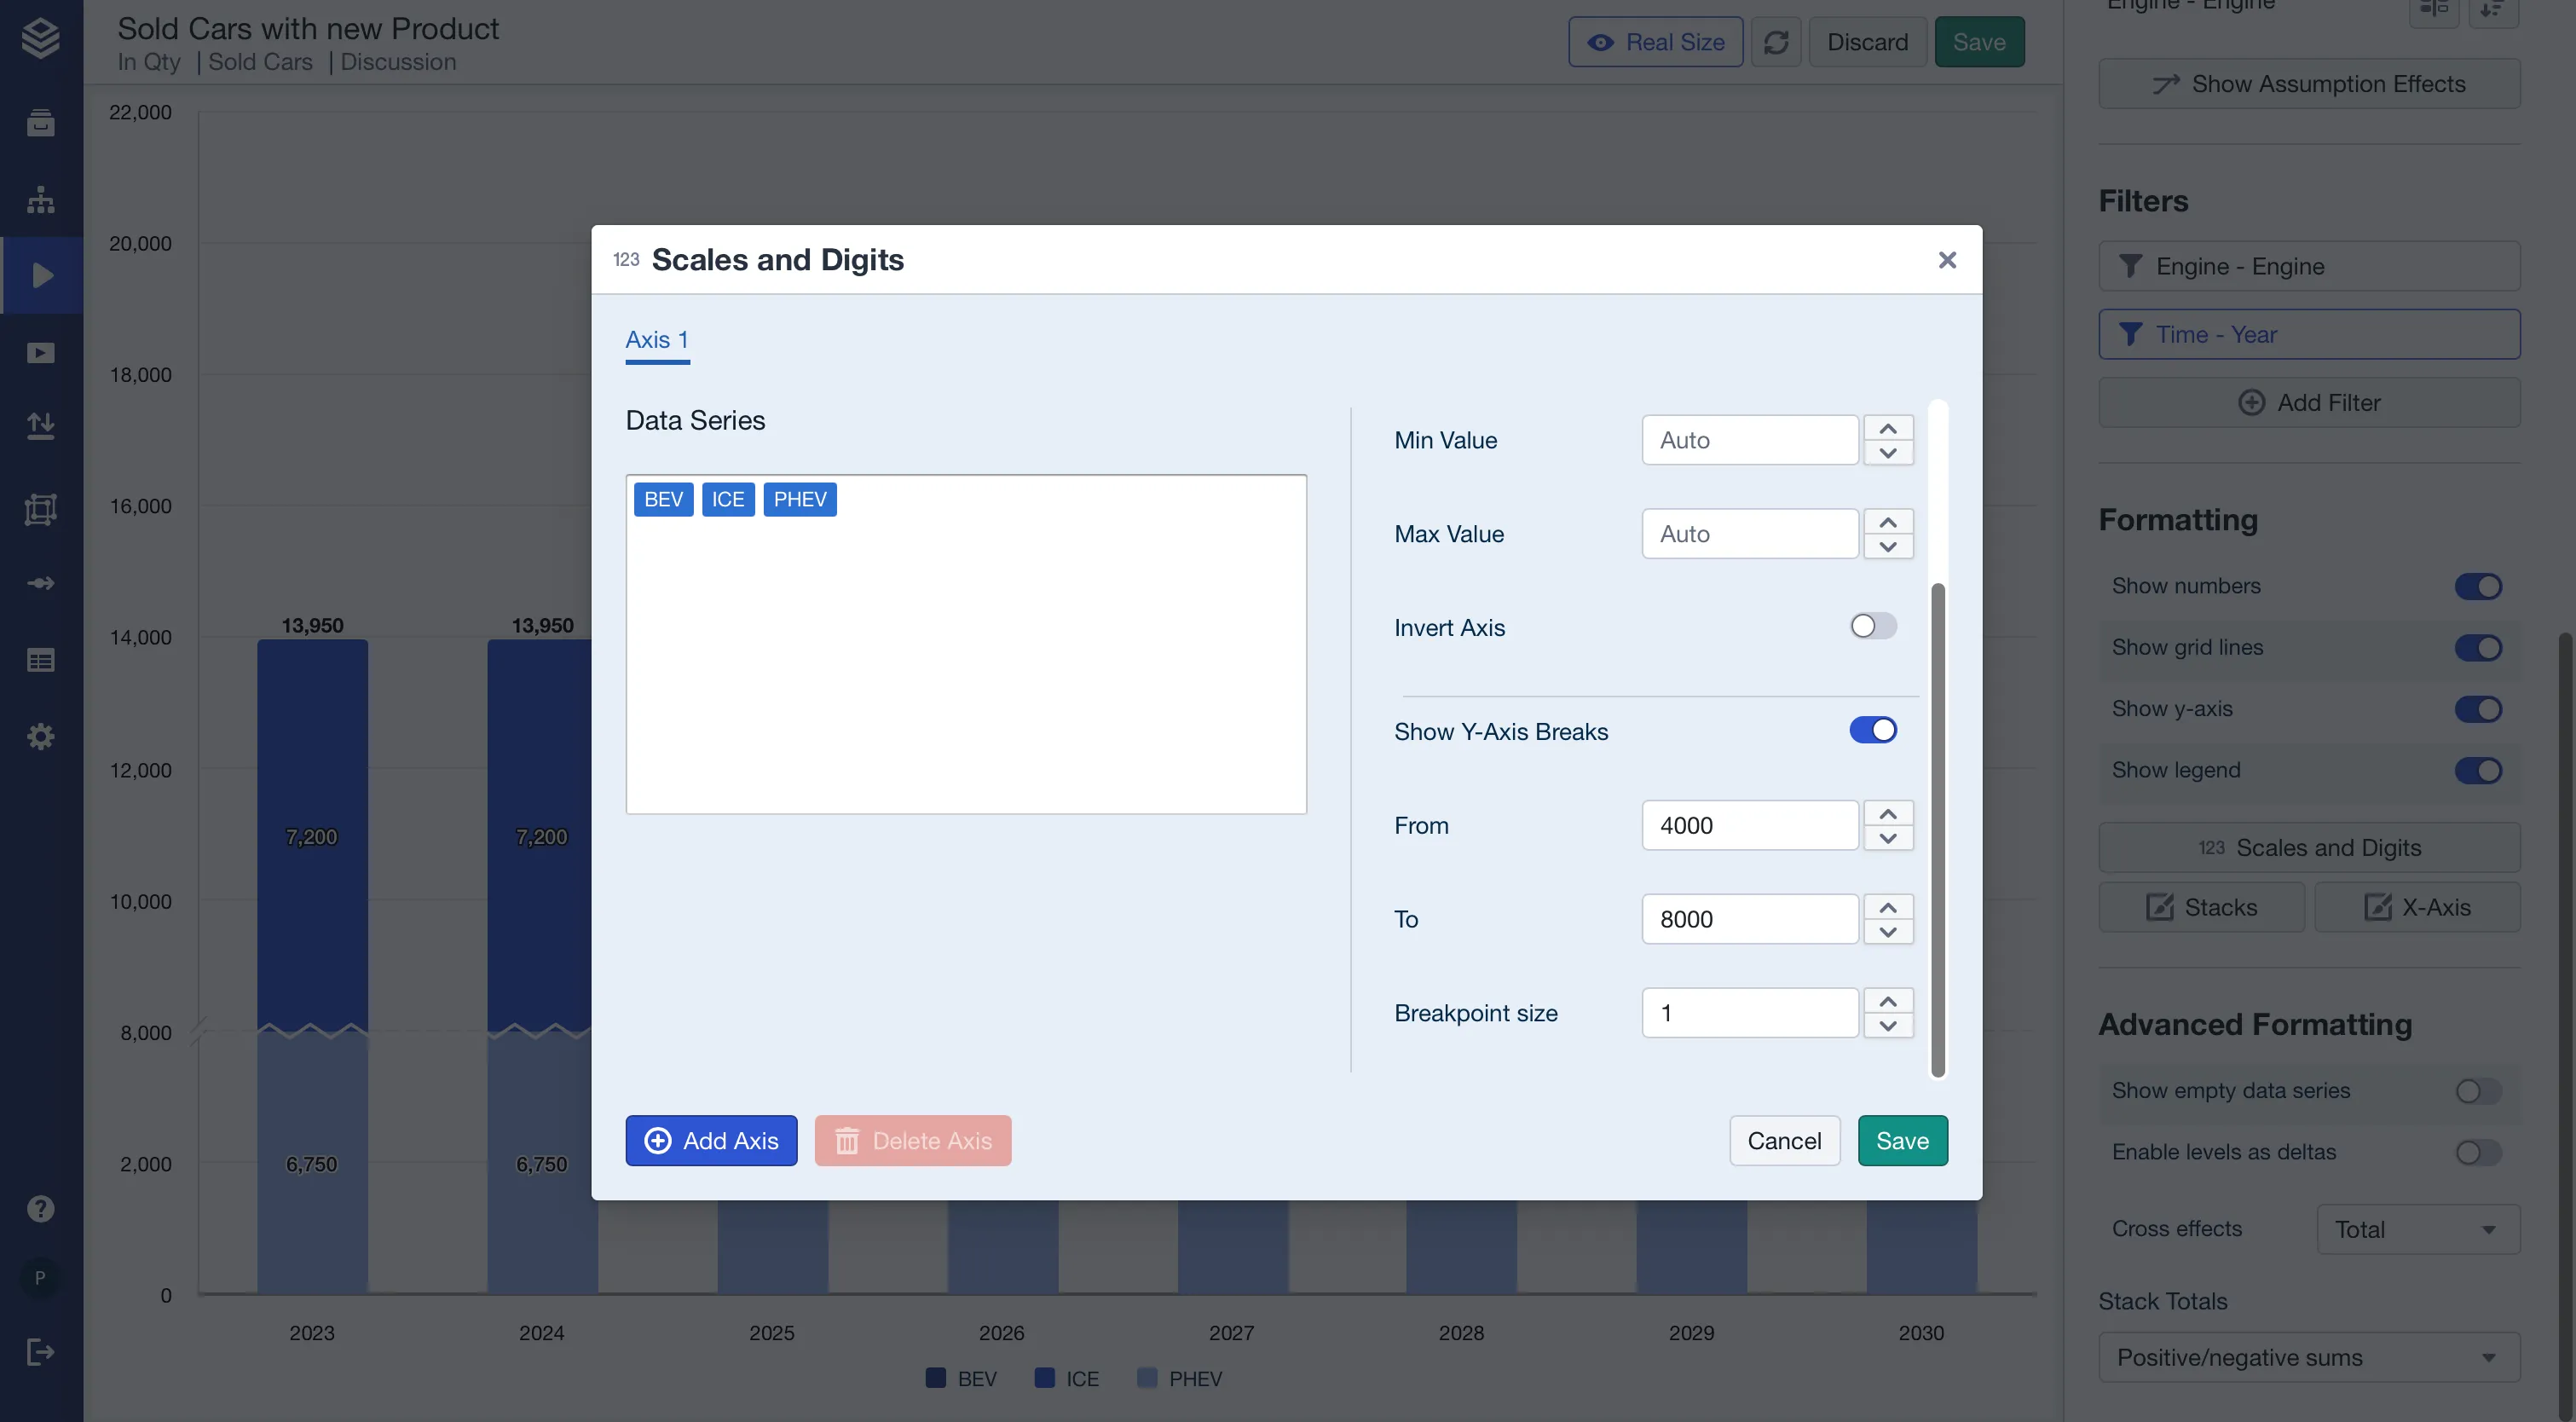
Settings
| Setting | Description | Default |
|---|---|---|
| Show Y-Axis Breaks | Turns the Y-axis break on or off for this chart. | Off |
| From | The value where the break starts: the lower bound of the range cut out of the axis. | 0 |
| To | The value where the break ends: the upper bound of the range cut out of the axis. | 0 |
| Breakpoint size | The visual size of the gap shown in the chart at the break. | 1 |
Supported chart types
Y-axis breaks are available for the standard cartesian chart types: line, column, bar, area, and mixed charts, as well as bridge (waterfall) charts.
Good to know
- Charts with multiple axes are not supported. On these charts the Show Y-Axis Breaks toggle is disabled.
- Only one break can be defined per chart.
- The From and To values must sit within your data’s value range for the break to be visible.