Assumption Effects
A central workflow when working with assumptions is to see what an individual assumption does to your plan. There are two ways to look at that: a bridge, which explains a whole difference as a chain of assumption effects, and an ordinary chart or table set to show the effect of the assumptions you pick.
How the effect is calculated
The effect of an assumption is the delta between two calculations of the same scenario:
- the selected scenario with the assumption
- the selected scenario without it
It does not matter whether the assumption is actually active in the scenario you selected. The calculated effect is the same either way, because both sides of the delta are computed for you.
What does change the number is which scenario you select. Assumptions interact, so the effect of one assumption depends on which others are in play around it. These cross-effects mean the same assumption can legitimately show a different value in two different scenarios.
Showing assumption effects in a chart or table
Show Assumption Effects can be switched on for any chart, which lets you display the effects using line charts, bar charts or tables rather than a bridge. At least one assumption has to be selected for it to show anything.
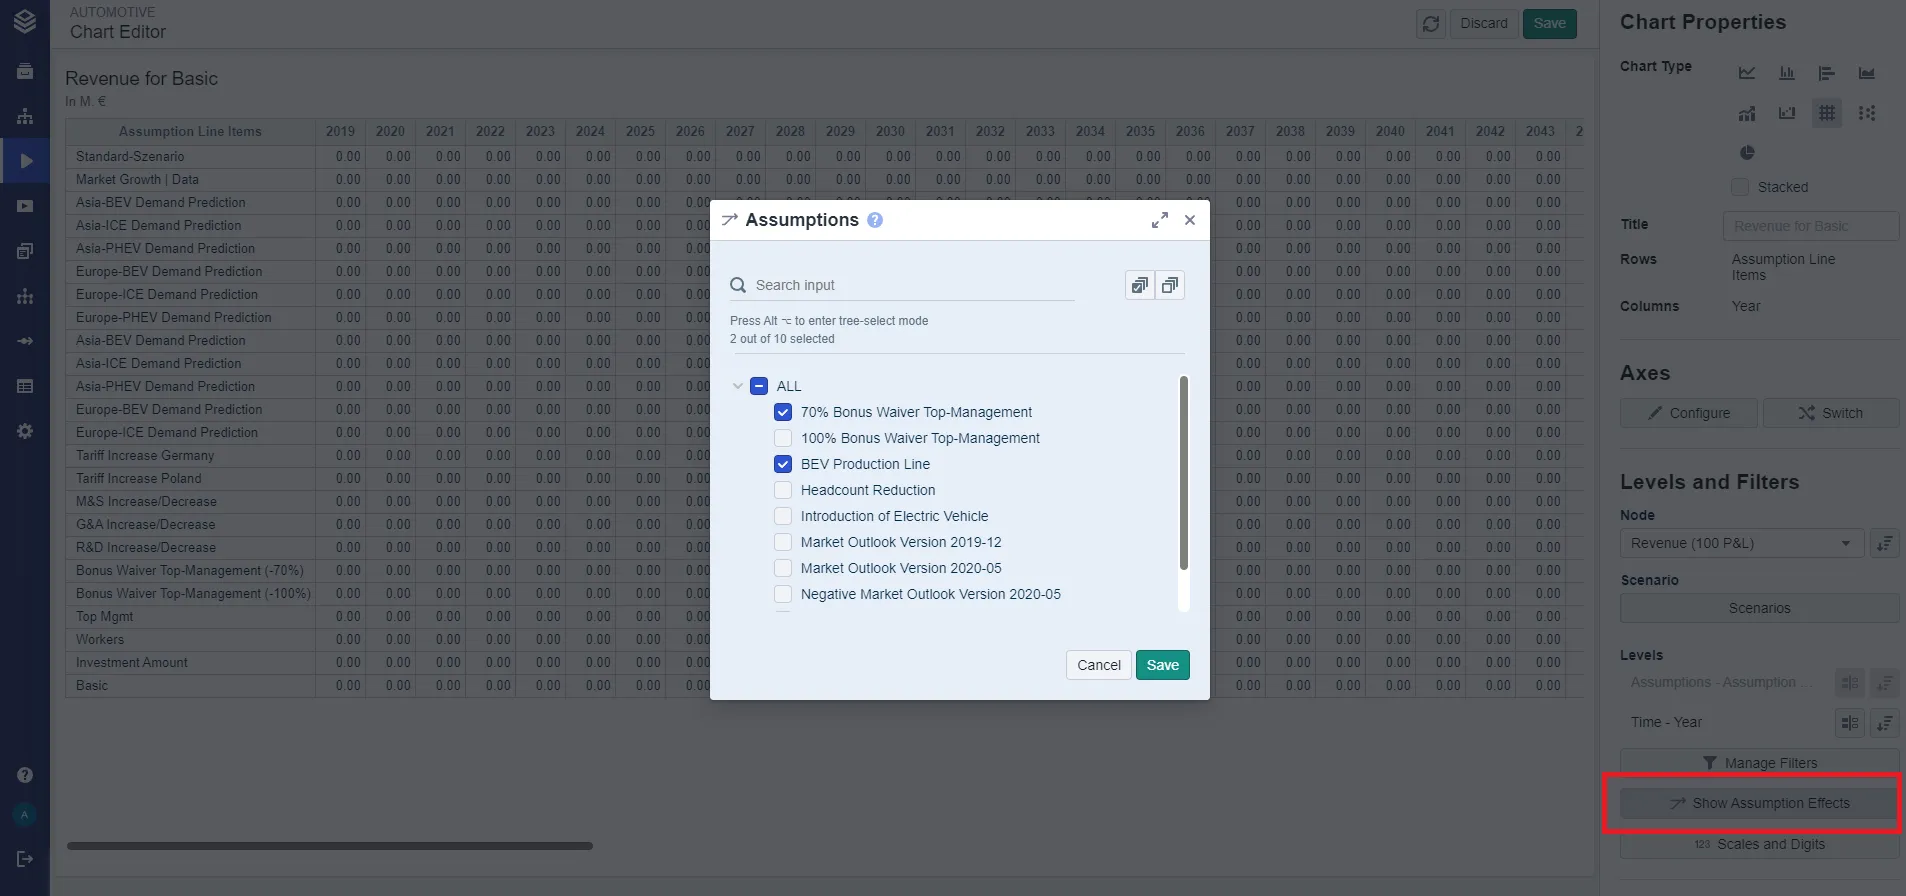
- The chart displays the effect of the assumptions you selected.
- The subtitle of the chart notes that you are looking at the individual effect of an assumption, rather than at the values themselves.
Showing assumption descriptions
An assumption can carry a custom description, and a bridge can show it when a reader hovers over that assumption’s bar. This saves explaining each step out loud when presenting.
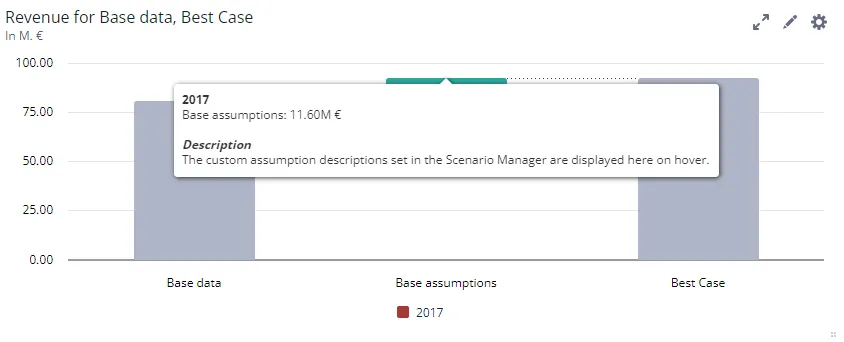
To set one up:
-
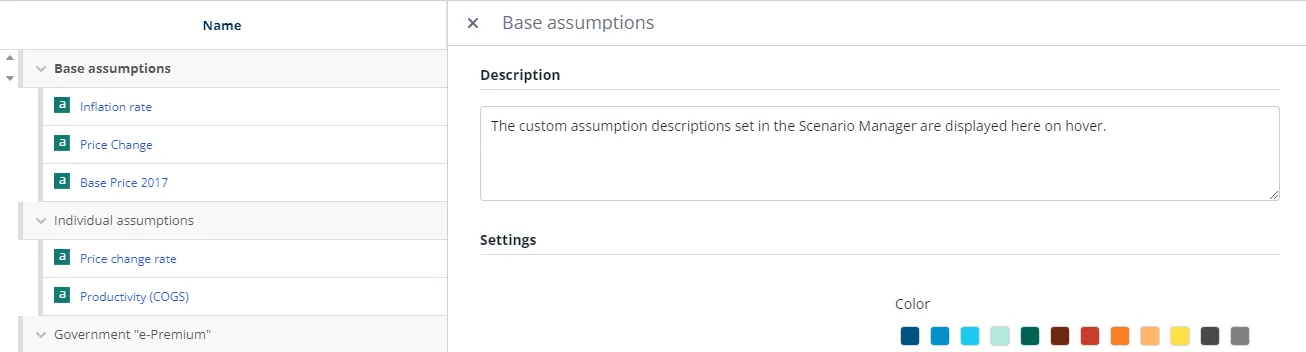
Click an assumption’s name to open its settings.
-
Write the text in the description box.
-
Select the chart and switch on Show descriptions in tooltips in the chart inspector.
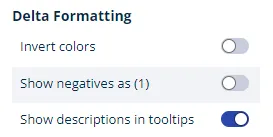
This works the same way in scenario bridges and time bridges.
Related
- Bridges: the two bridge types, which show these effects as a staircase.
- Grouping Assumption Effects: combine the line-items of one assumption into a single bar.
- Scenario Bridges: explain a difference between scenarios.
- Time Bridges: explain a difference between periods.