Release Notes 7.2.0
7.2 brings more precision to your planning models. Define variables that calculate automatically, add visual breaks to charts with large value ranges, and navigate formulas across submodels with confidence.
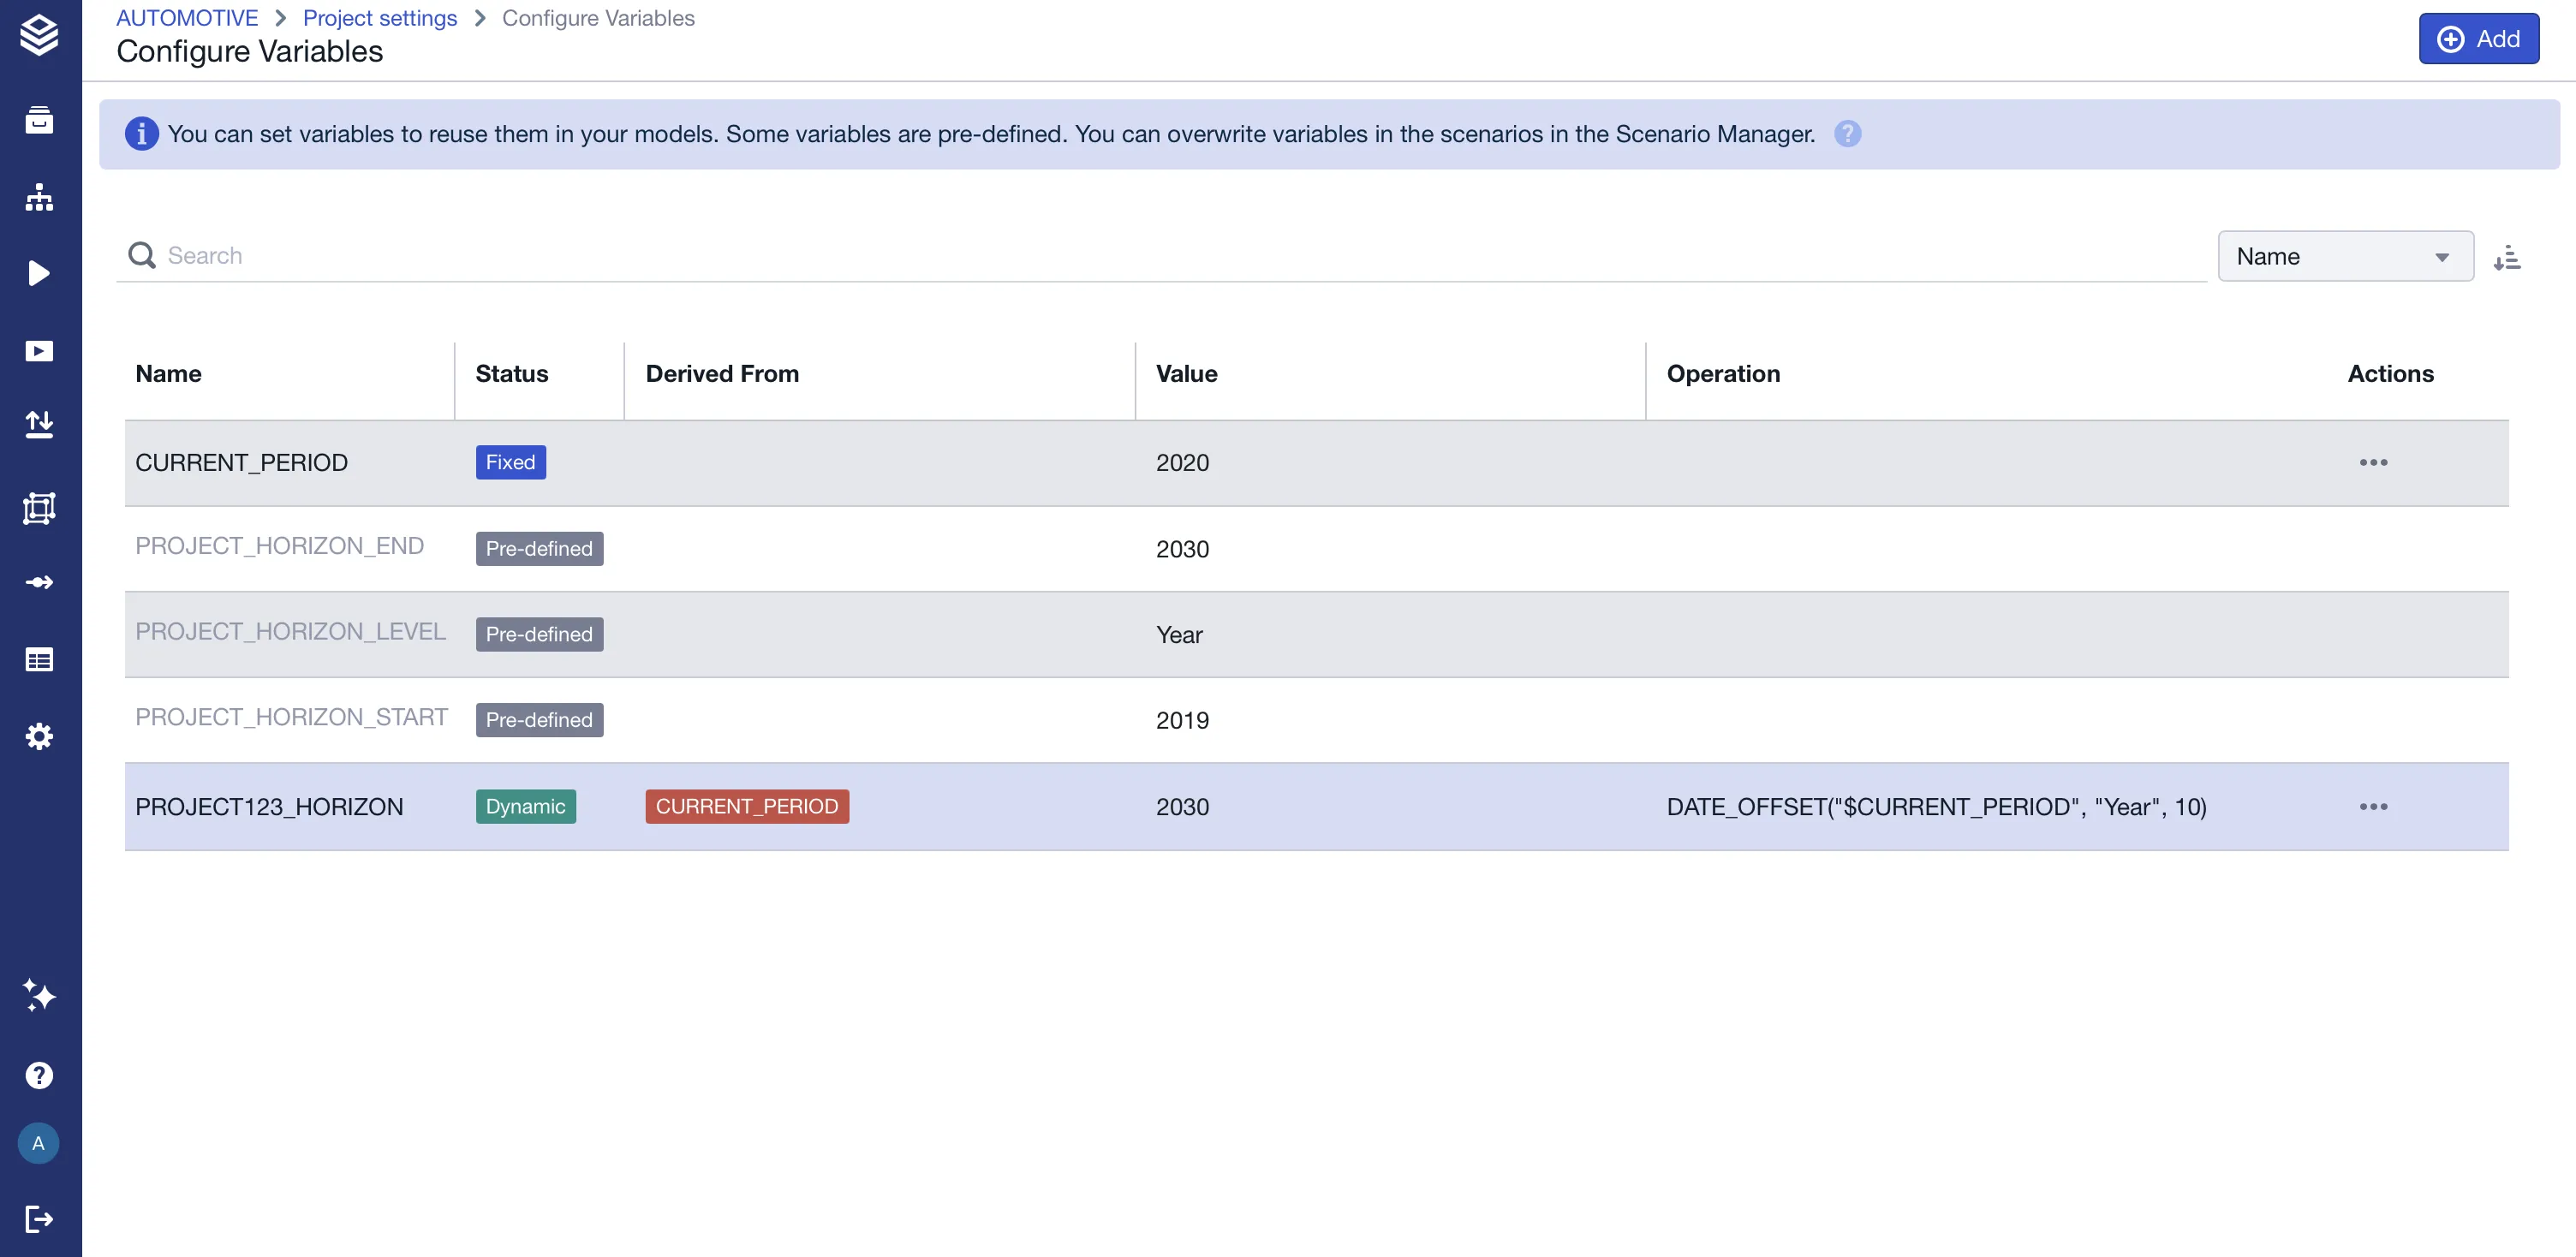
- Dynamic project variables
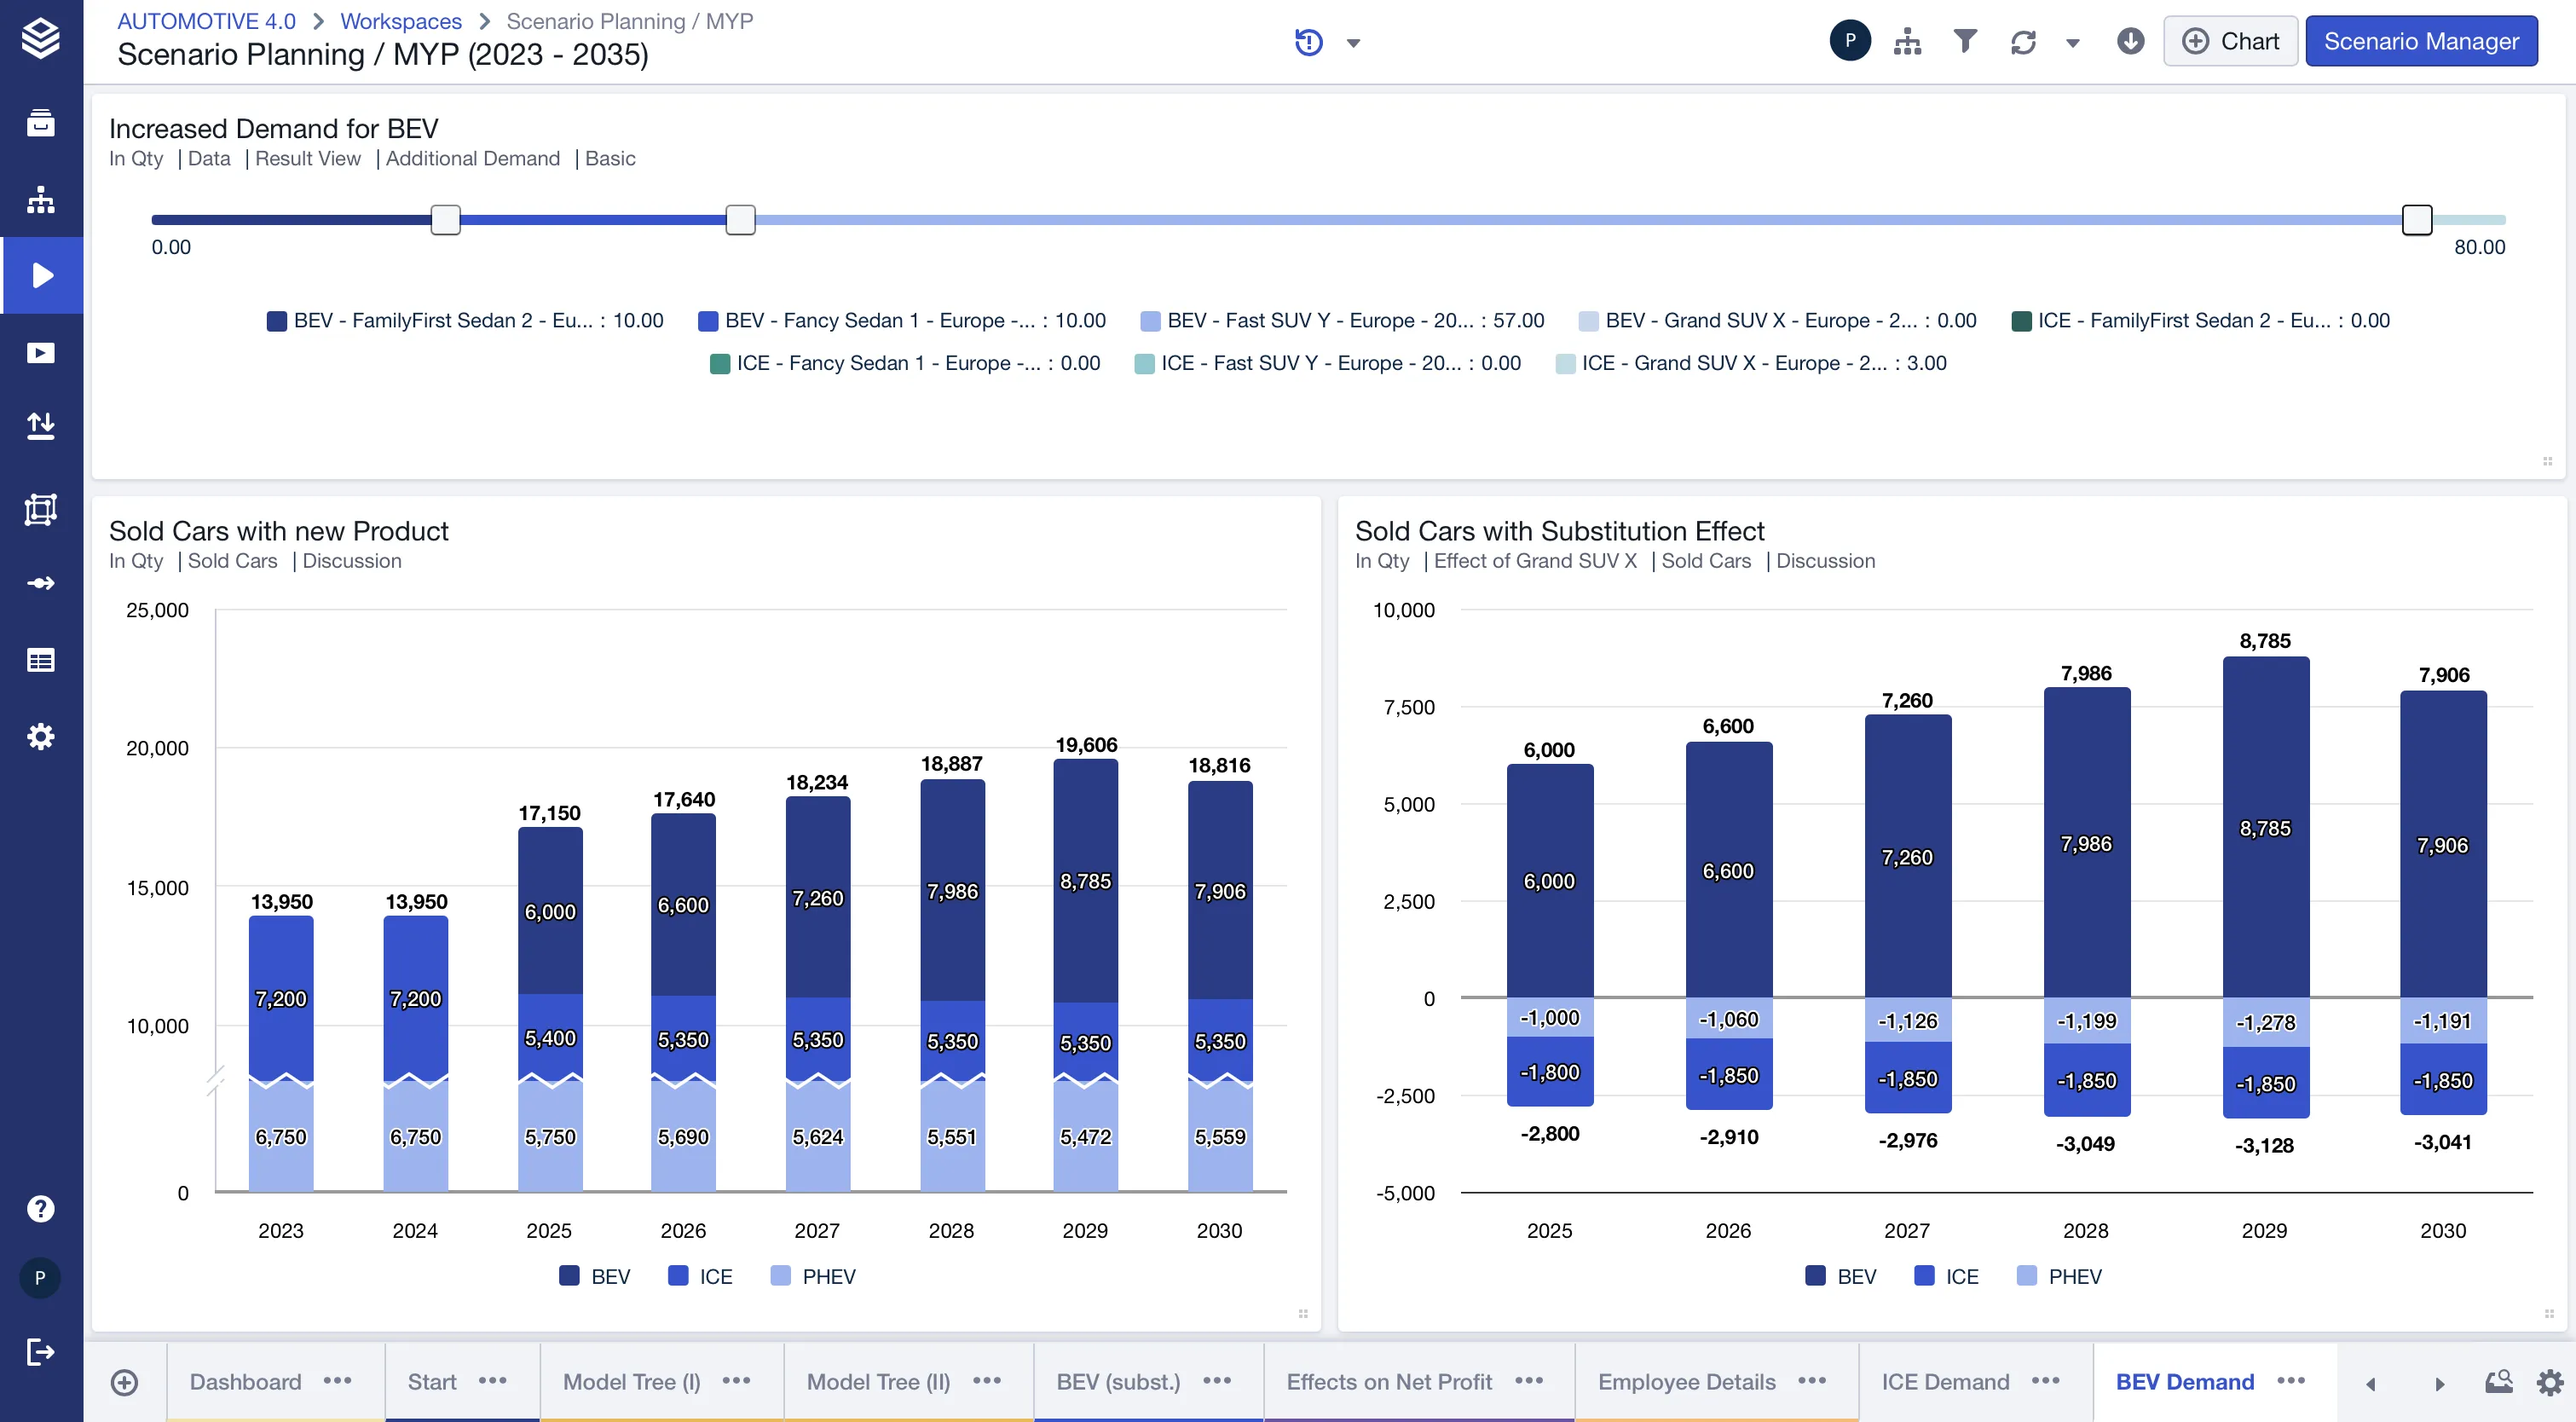
- Add breaks to chart axes
Dynamic project variables
- Define variables that calculate automatically based on other variables: for example, set
$ForecastEndto always stay 12 months ahead of$ForecastStart - Write date formulas with autocomplete and syntax highlighting directly in the variable editor
- All variables, fixed and dynamic, are available in node operations across your model
- Fixed variables can still be overridden per scenario; dynamic variables always reflect their formula result
Add breaks to chart axes
- Add a visual break to the Y-axis on charts where values differ by large amounts, making all data points easier to read
- Configure the break range and visual gap size directly in the chart’s scale settings
- Supported for line, bar, column, area, and bridge charts
Other improvements
- Delete dimension values in bulk Upload dimension updates via Excel even when existing values are still in use. A warning callout identifies which rows are affected before you confirm the deletion. Learn more.
- View formulas across submodels Open the Function Editor on any node and immediately see if it belongs to a different submodel: a lock icon and tooltip tell you where to go to edit it. The formula is visible but protected from accidental changes.
For detailed information on these features and more, visit our documentation.
Happy Simulating!