Input Tables
An input table brings simulating and viewing together: values are typed straight into a table on the worksheet and the effect shows up immediately, with no switching between screens.
What it is
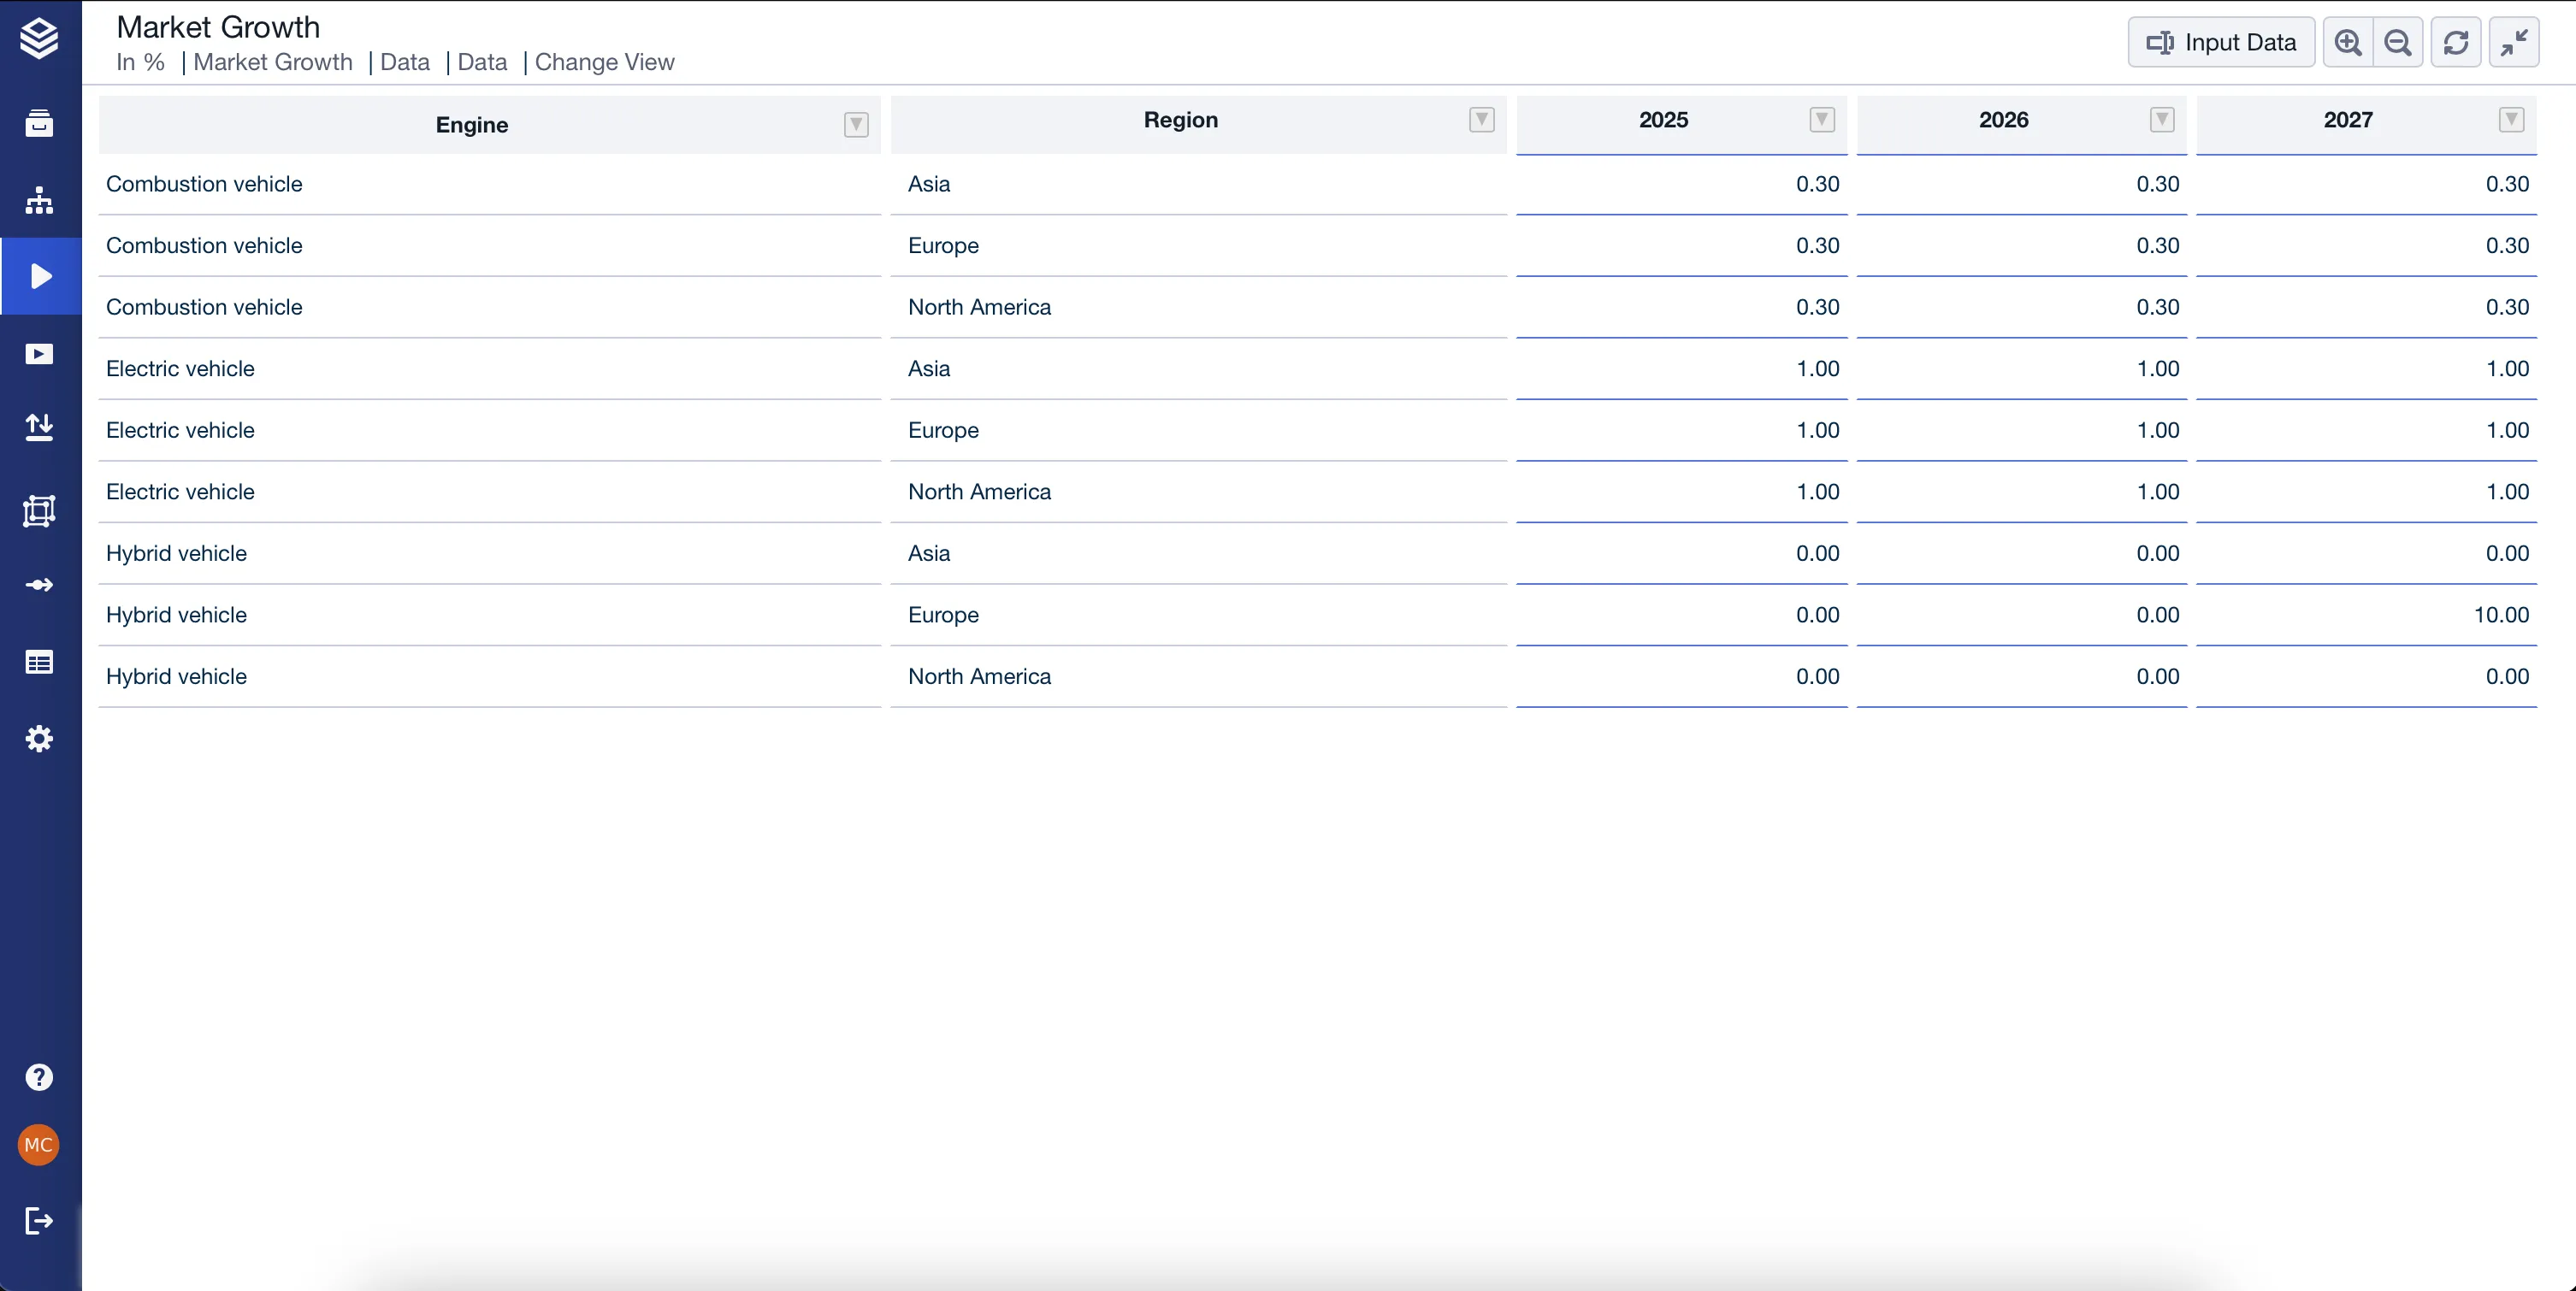
An input table looks like an ordinary table, but it has an Input Data mode. In that mode the cells accept typed values, and saving them applies the change across your scenario.
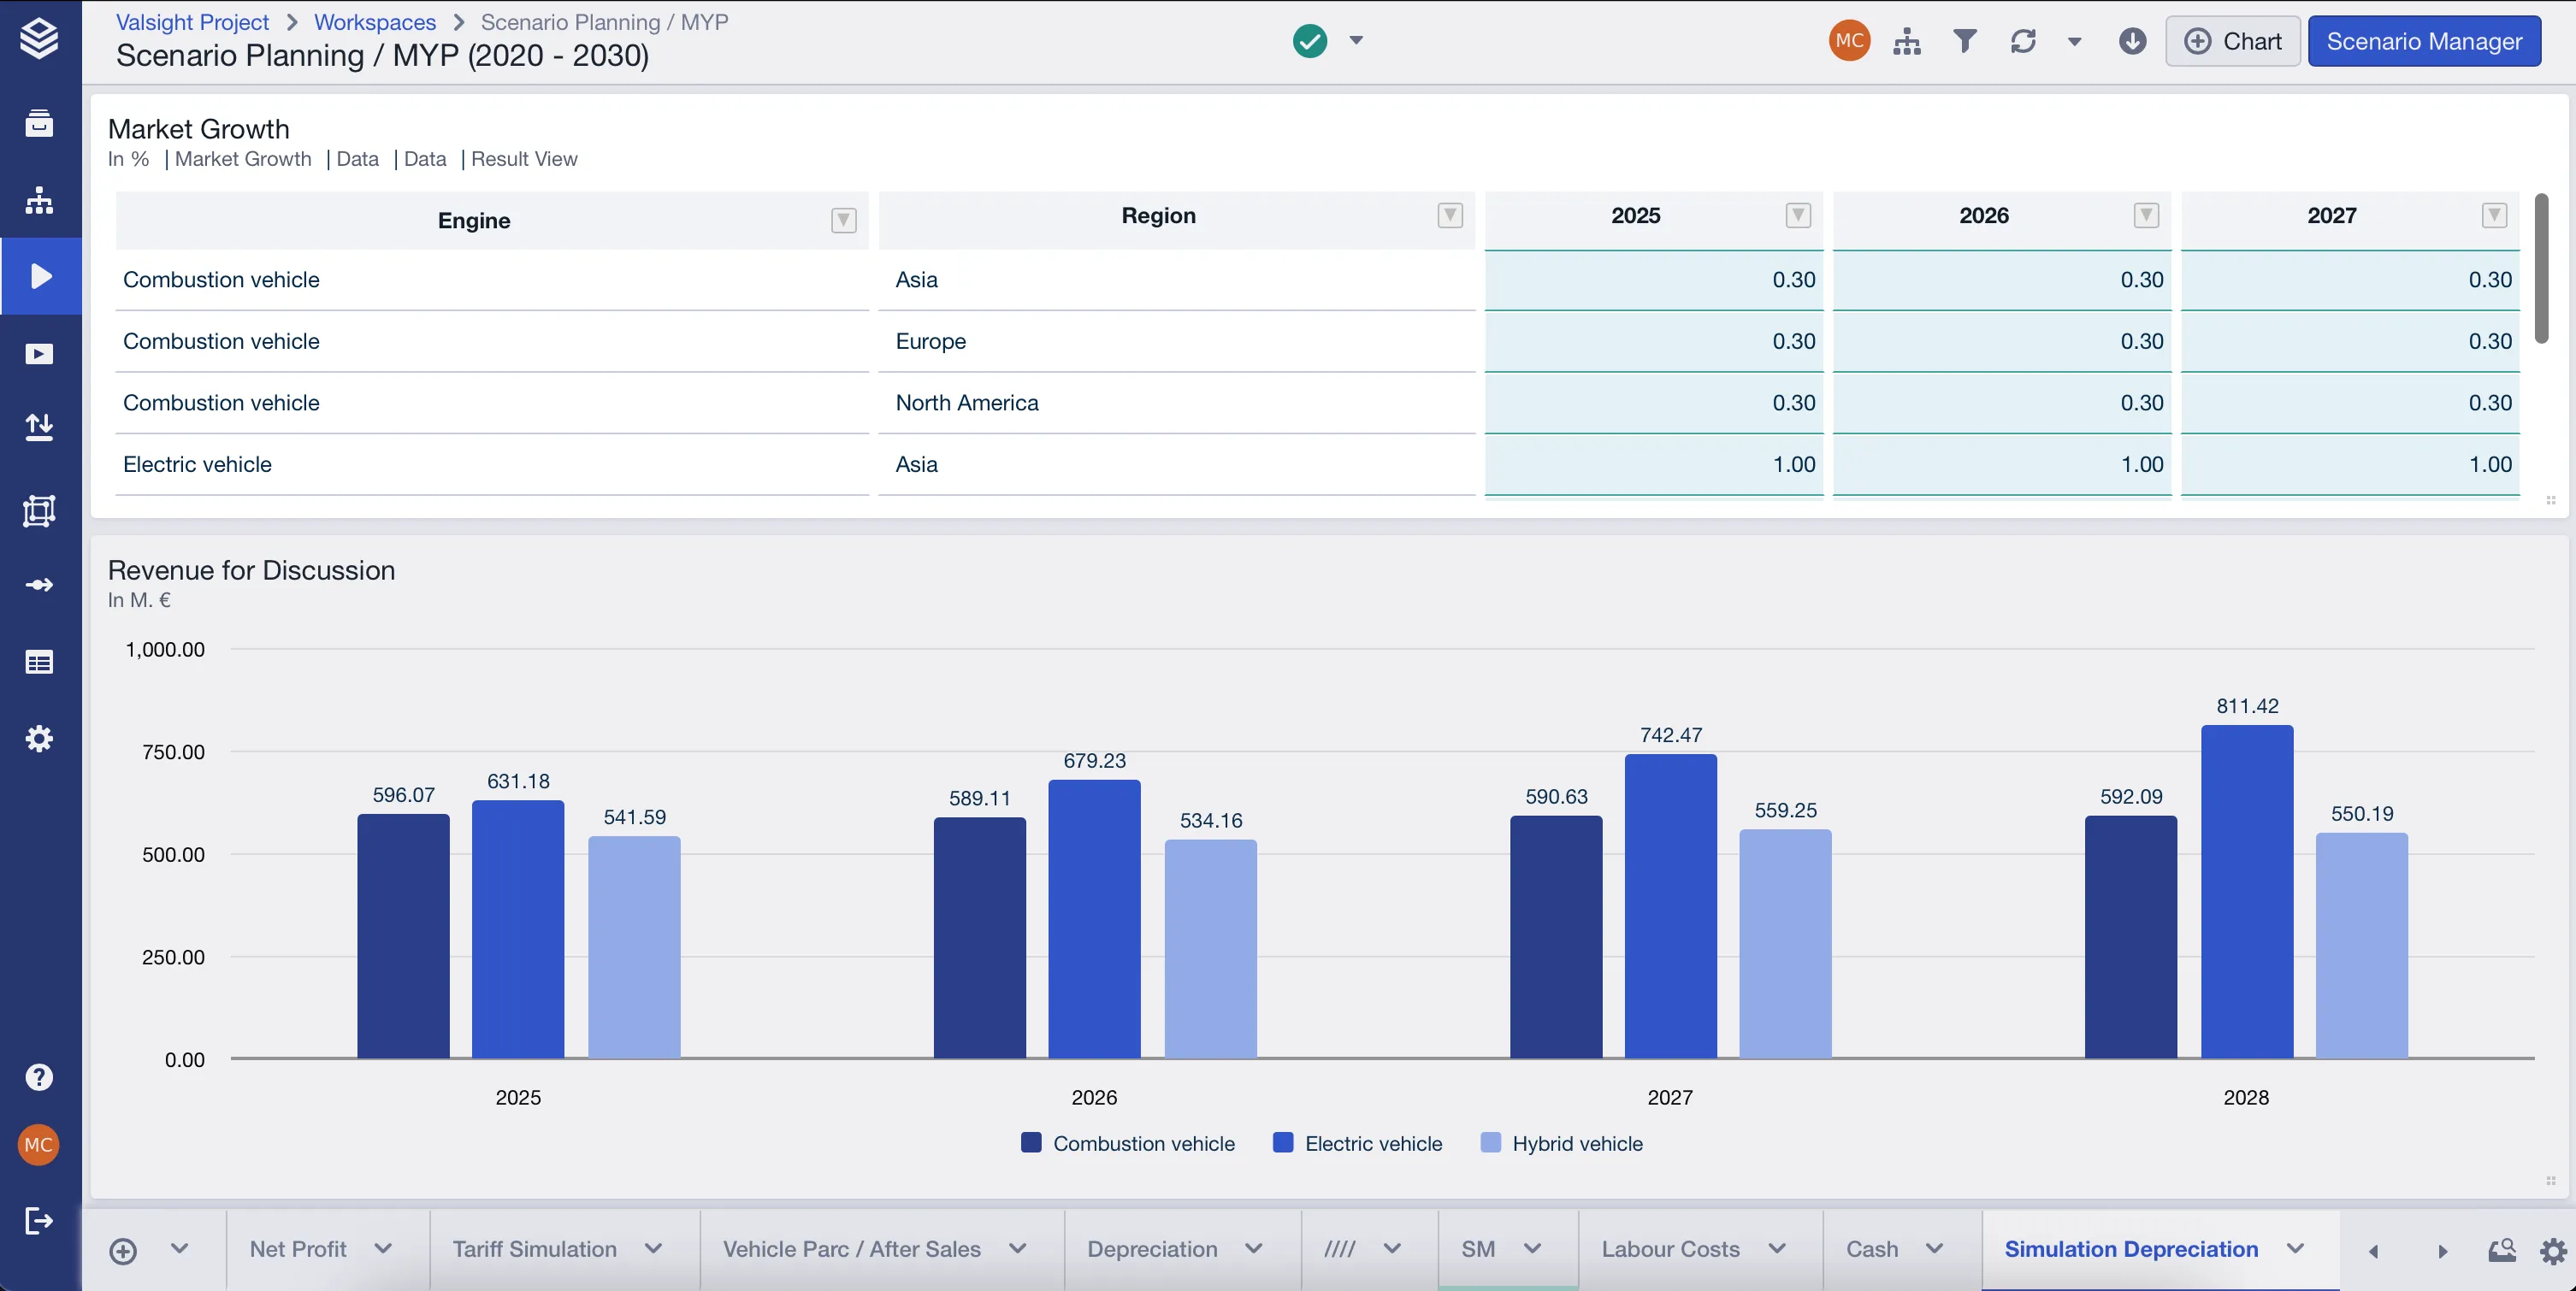
Each input table edits one line-item, in one of two views:
| View | What you type |
|---|---|
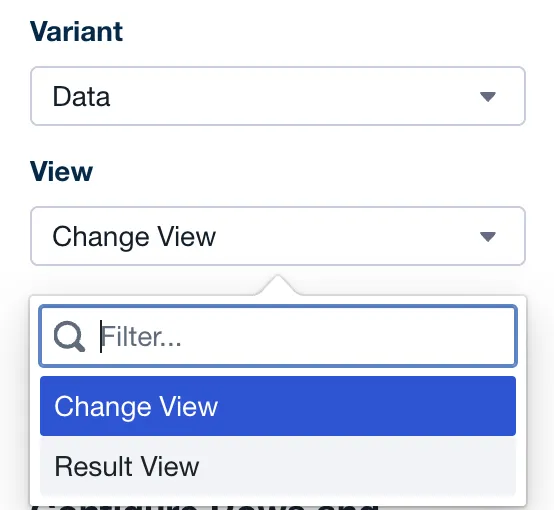
| Change View | Relative changes, for example a percentage uplift. |
| Result View | Absolute values, which replace what is there. |
When to use it
- You want a reader to try their own numbers without opening the Scenario Manager.
- You want to enter many values at once, which is faster in a grid than with sliders.
- You want to set a total that other tiles then divide up, for example one feeding a split slider.
Use a slider instead for a single value that is better dragged than typed, and a plain table when readers should only read the numbers.
Configuration
-
Click + Chart in the workspace.
-
Go to the Simulations category and select Input Table.

-
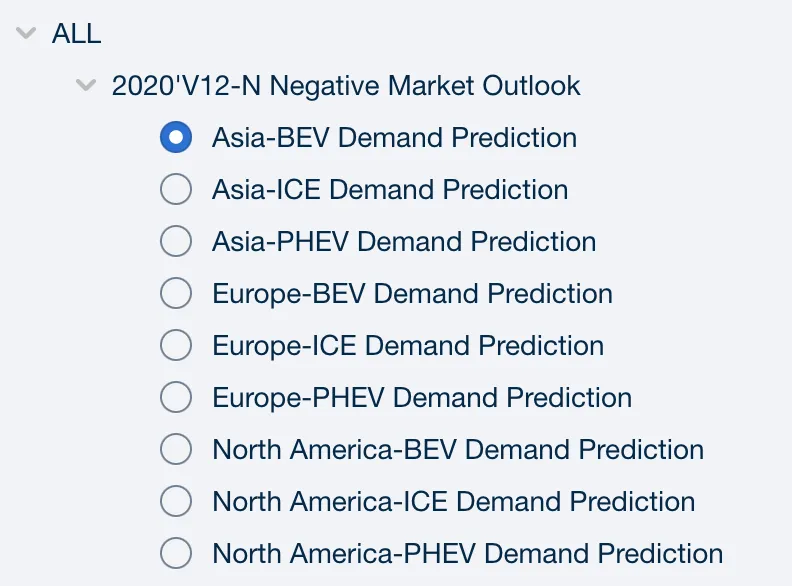
Choose the Line Item to edit, and the variant to modify.
-
Edit the Table title if you want something other than the proposed one.
-
Choose Change View or Result View.
-
Optionally apply filters to narrow the table to the rows that matter. A filter icon appears when you hover over a filtered table.
Entering values
-
Hover over the input table tile and click Input Data in the top right corner.
-
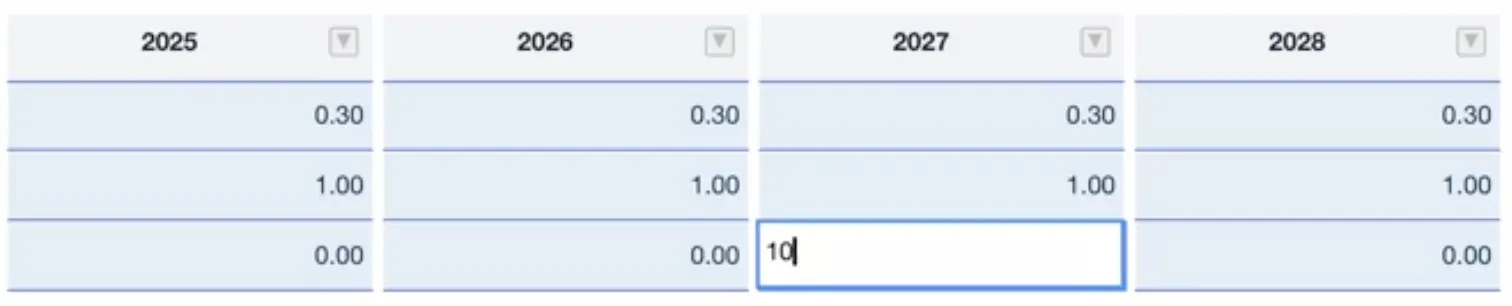
Type values into the cells to test an assumption.
-
Click Save to apply the change across the scenario. Every linked table updates automatically.
Good to know
- What you type depends on the view. In Change View a
10is a relative change; in Result View the same10is an absolute value. Check which view a table uses before entering numbers. - Nothing is applied until you save. Values typed in Input Data mode take effect on the scenario only when you click Save.
- A table can be maximized while you work. Expanding it for easier entry does not lose what you have typed.
- Perspective and sheet filters apply. They adjust the data shown in the table automatically, so the rows you see may depend on the sheet’s current perspective.
Related
- Sliders: drag a single line-item’s value instead of typing it.
- Split Sliders: redistribute a total across its parts while the total stays fixed.
- Chart Types: the other tiles you can place on a worksheet.