ARIMA
ARIMA('Node', p, d, q, P, D, Q, m)
The ARIMA function is a forecasting function based on the autoregressive integrated moving average (ARIMA) model. Learn more.
Use this function when you want to forecast a time series from historical patterns without defining explicit driver nodes.
Parameters
- NodeNode referenceRequired
- Node that contains the base data for the forecast. It must contain at least one time level. Predictions are based on the time values in the node and extend to the end of the horizon period.
- pNumberRequired
- The order (number of time lags) of the autoregressive model.
- dNumberRequired
- The degree of differencing.
- qNumberRequired
- The order of the moving-average model.
- PNumberRequired
- Autoregressive term for the seasonal part.
- DNumberRequired
- Differencing term for the seasonal part.
- QNumberRequired
- Moving average term for the seasonal part.
- mNumberRequired
- The number of periods in each season.
Watch out
- If the input data has a missing value in the time dimension, the calculation fails. A time value is considered missing if the data has actual value(s) before and after the missing value. For example,
[2019, 2021]has missing value2020, but[2020, 2021]or[2019, 2020]have no missing values.
Example
Monthly forecast from historical data
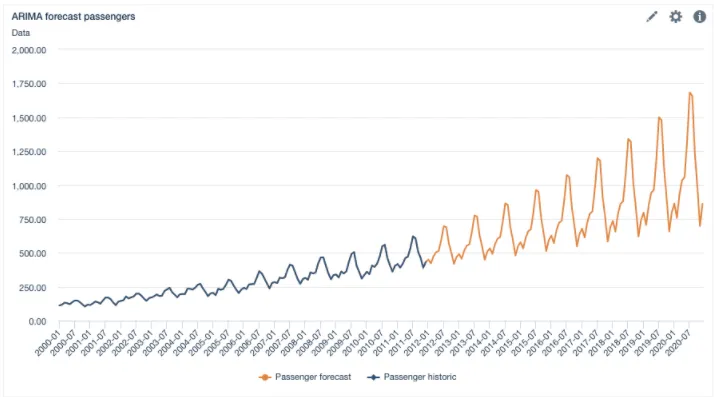
This example shows monthly historical passenger data used as the basis for an ARIMA forecast. The result keeps the historical observations and extends the series with forecasted periods to the end of the horizon.
Input node: 'Passenger historic'
Data set: Passenger historic.xlsx
Data horizon: 2000 - 2011
| Year | Month | Value |
|---|---|---|
| 2000 | 2000-01 | 112 |
| … | … | … |
| 2011 | 2011-12 | 432 |
Formula: ARIMA('Passenger historic', 1, 1, 1, 1, 0, 1, 12)
ARIMA horizon: 2000 - 2020
| Year | Month | ARIMA Result |
|---|---|---|
| 2000 | 2000-01 | 112 |
| … | … | … |
| 2011 | 2011-12 | 432 |
| 2012 | 2012-01 | 450 |
| … | … | … |
| 2020 | 2020-12 | 861 |
The rows through 2011 repeat the historical input values unchanged; the rows from 2012 onward are the new forecasted periods.
Chart:
Related
- ROLLFORWARD_ADVANCED
- When you want to project values with explicit driver nodes instead of forecasting from historical patterns alone.
- MOVINGAVG
- When you want to smooth historical values over a rolling window instead of creating a forecast.