Split Sliders
A split slider redistributes a total across its parts, without changing the total. Drag one handle and the others move to compensate, which makes it the tile to reach for when you are adjusting a product mix, reallocating a budget or rebalancing resources.
What it is
A split slider shows one line-item as a single track with a handle between each pair of neighboring parts. The legend below the track names every part and its current share.
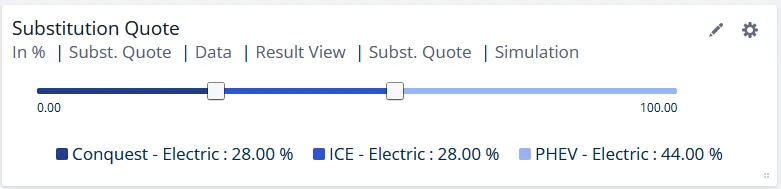
The total is fixed. Moving a handle takes from one part and gives to another, so the shares always add up to the same figure they started at. This is the difference from an ordinary slider, which changes one line-item’s value on its own and lets the total move with it.
Dragging one handle rebalances the others for you. When two shares sit close together and their handles overlap, click the empty track between them to push them apart.
Each split slider shows one line-item at a time, in one of two views:
| View | What you get |
|---|---|
| Change View | You enter the values directly, as changes. |
| Result View | The values shown include the effects of every other line-item active in the chosen scenario. For your edits to reach that scenario, the selected variant must be active in it. |
A scenario is selected in both views; what differs is only what the numbers mean. Result View is preselected for a split slider.
When to use it
- You want to shift the mix between products, regions or technologies while the volume stays where it is.
- You want to move budget from one cost line to another without changing what you are spending overall.
- You want people to rebalance an allocation on the worksheet itself, rather than in the Scenario Manager.
Use another tile instead if the total is what you want to change:
- A slider changes a single line-item by an absolute amount, and the total moves with it.
- An input table is the way to change the total that a split slider then divides up.
- A line-item table is the better fit when the values should not be tied to a fixed total at all.
Configuration
- Add a chart to your worksheet and select Split Slider in the chart type selection.
- Select the line-item you want to redistribute.
- Choose a variant, if the line-item has more than one.
- Select the View, either Change View or Result View.
- Select the scenario you want to apply. Create stays disabled until the variant, the view and the scenario are all chosen.
- Click Create to place the split slider on the worksheet.
Once the tile is on the sheet, the chart editor lets you:
| Setting | What it does |
|---|---|
| Line item, Variant, View, Scenario | Point the tile at different data, or switch between Change View and Result View, without rebuilding it. |
| Sorting | The Levels button opens the sort dialog, which reorders the parts and with them the legend. |
| Filters | Cut a large line-item down to the parts you actually want to redistribute. |
Step size is not a chart setting. It comes from the line-item itself, under Sliders > Step Size in the Scenario Manager. Set it to match the scale of your data: too large and you cannot fine-tune a share, too small and the handles feel unresponsive.
Good to know
- Twenty parts is the limit. Above 20 rows the tile reports that there are too many items to display instead of drawing the slider, which keeps the handles far enough apart to be usable. Filter the line-item down if you hit it.
- Negative values are not supported. A line-item has to hold positive values only, because a mix of signs makes the total ambiguous to divide up.
- A line-item that is all zeros cannot be split. The tile reports that there is nothing to split rather than showing empty handles. Pick a line-item that carries data.
- Handles can end up on top of each other. When two shares are close, click the empty track between the handles to push them apart, rather than trying to grab one.
- A read-only tile means stale data. A split slider locks itself when the data behind it is out of date, so that you cannot write changes onto figures that no longer hold. Reload the page to get editing back.
- An empty tile usually means the filters left nothing. Check the tile’s filters against the line-item’s values.
- A split slider is not exported and not presented. It is left out of XLSX exports, and in presentation mode the tile shows a note instead of the slider. Move or duplicate does work, including to another workspace.
Related
- Sliders: the ordinary slider tile, for changing one line-item on its own.
- Input Tables: enter values on the worksheet, including the total a split slider divides.
- Sliders in the Scenario Manager: where step size and the other slider settings live.
- Chart Types: the other tiles you can place on a worksheet.