Data Effects Display in Bridge
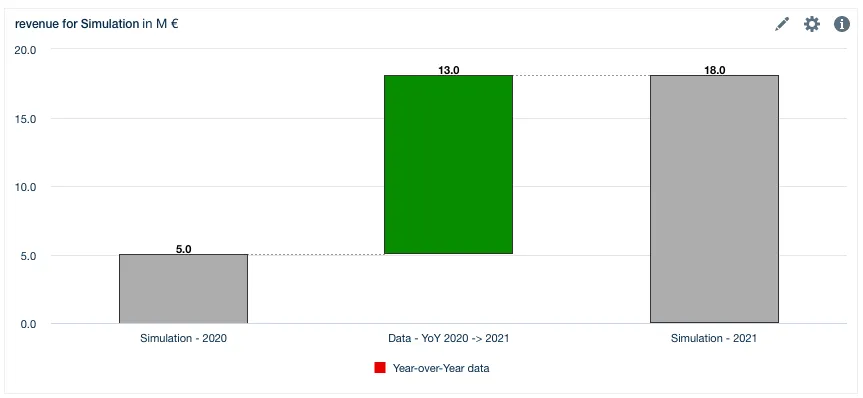
If you look at a bridge that analyzes differences from one year to the other, you will see the base values for both years and a number of smaller steps that lead from one base to the other. These differences come from two different sources:
- Differences in the model (“Data effects”): “Base data - YoY 2020 → 2021”
- Differences in the simulation (“Simulation effects”): “Base assumptions”, “Individual assumptions”, …
Differences in the model are, in most cases, circumstances that you cannot influence (like fixed costs); by default, they are displayed in one large block. If you want to split them up per node or group them together, you can mark the respective nodes in the model and activate the setting in the chart.
Goal
Break the model’s own contribution to a time bridge out of its single block, either into one effect per node or into named groups of nodes such as a combined “price effect”.
Prerequisites
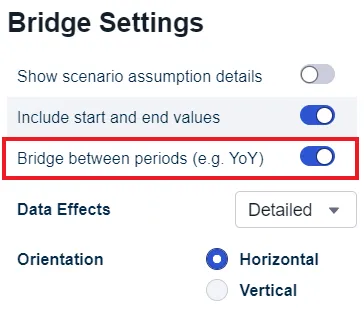
- A time bridge on your worksheet. Choose one scenario and two years, quarters or months, then select Bridge between periods (e.g. YoY).
- Edit rights on the model the nodes live in, since part of the setup happens in the model editor.
Steps
Show data effects per node
-
Open the model the node lives in.
-
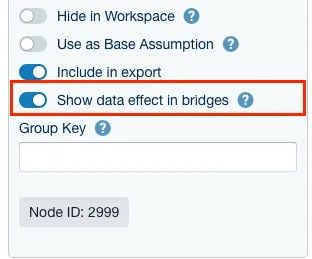
Select the node and switch on Show data effect in bridges.
-
Go back to the workspace, select your bridge, and set Data effects in Bridge Settings to Detailed.
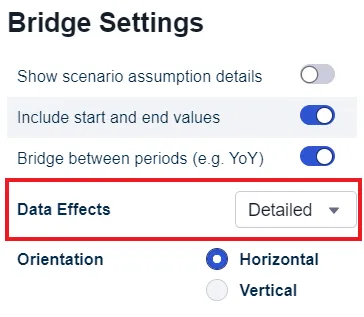
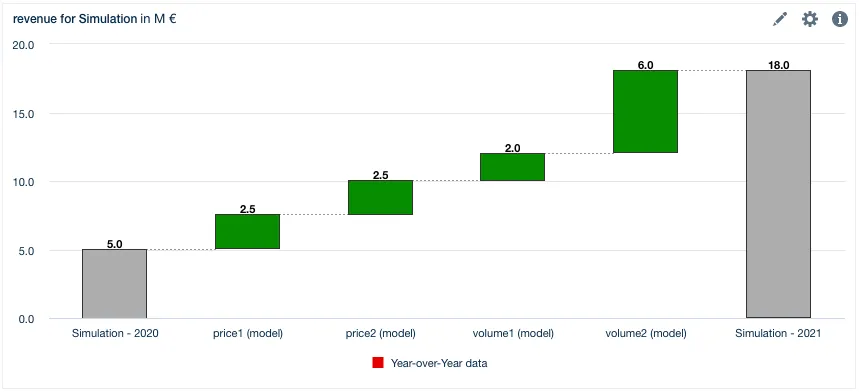
The bridge now shows a separate effect per node, each carrying the node’s name with (model) appended.
-
Group several nodes into one effect
-
In the model editor, fill in the Group Key field on each node you want combined. Nodes sharing a group key become one block in the bridge, which is how you build something like a single “price effect” out of several nodes.
-
Set Data effects in Bridge Settings to Grouped.
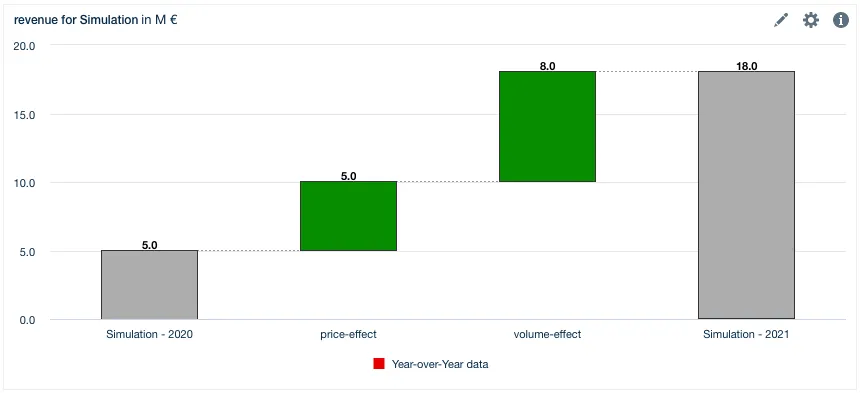
The group key is also the name shown in the chart, so it doubles as the label.
-
Verify
Your bridge’s data effects are no longer a single block:
- With Detailed, one step per marked node, each labeled with the node name and (model).
- With Grouped, one step per group key, labeled with that key.
If the block is still whole, check that Show data effect in bridges is switched on for the nodes and that Data effects is not still on Total, which is its default.
Related
- Time Bridges: creating the bridge in the first place, and how the effects are calculated.
- Assumption Effects: how the simulation side of a bridge is derived.
- Grouping Assumption Effects: the equivalent grouping for assumption effects.