Grouping Assumption Effects in Bridges
An assumption can be made up of several line-items. In a bridge, those line-items can either step through the chart one bar at a time or be combined into a single bar for the assumption as a whole.
What it is
Group Assumption Effects is a toggle in a bridge’s settings. It decides which of the two you get:
| Toggle | What the bridge shows |
|---|---|
| Off | One bar per line-item, so you can read the effect of each one separately |
| On | One bar per assumption, combining its line-items into a single effect |
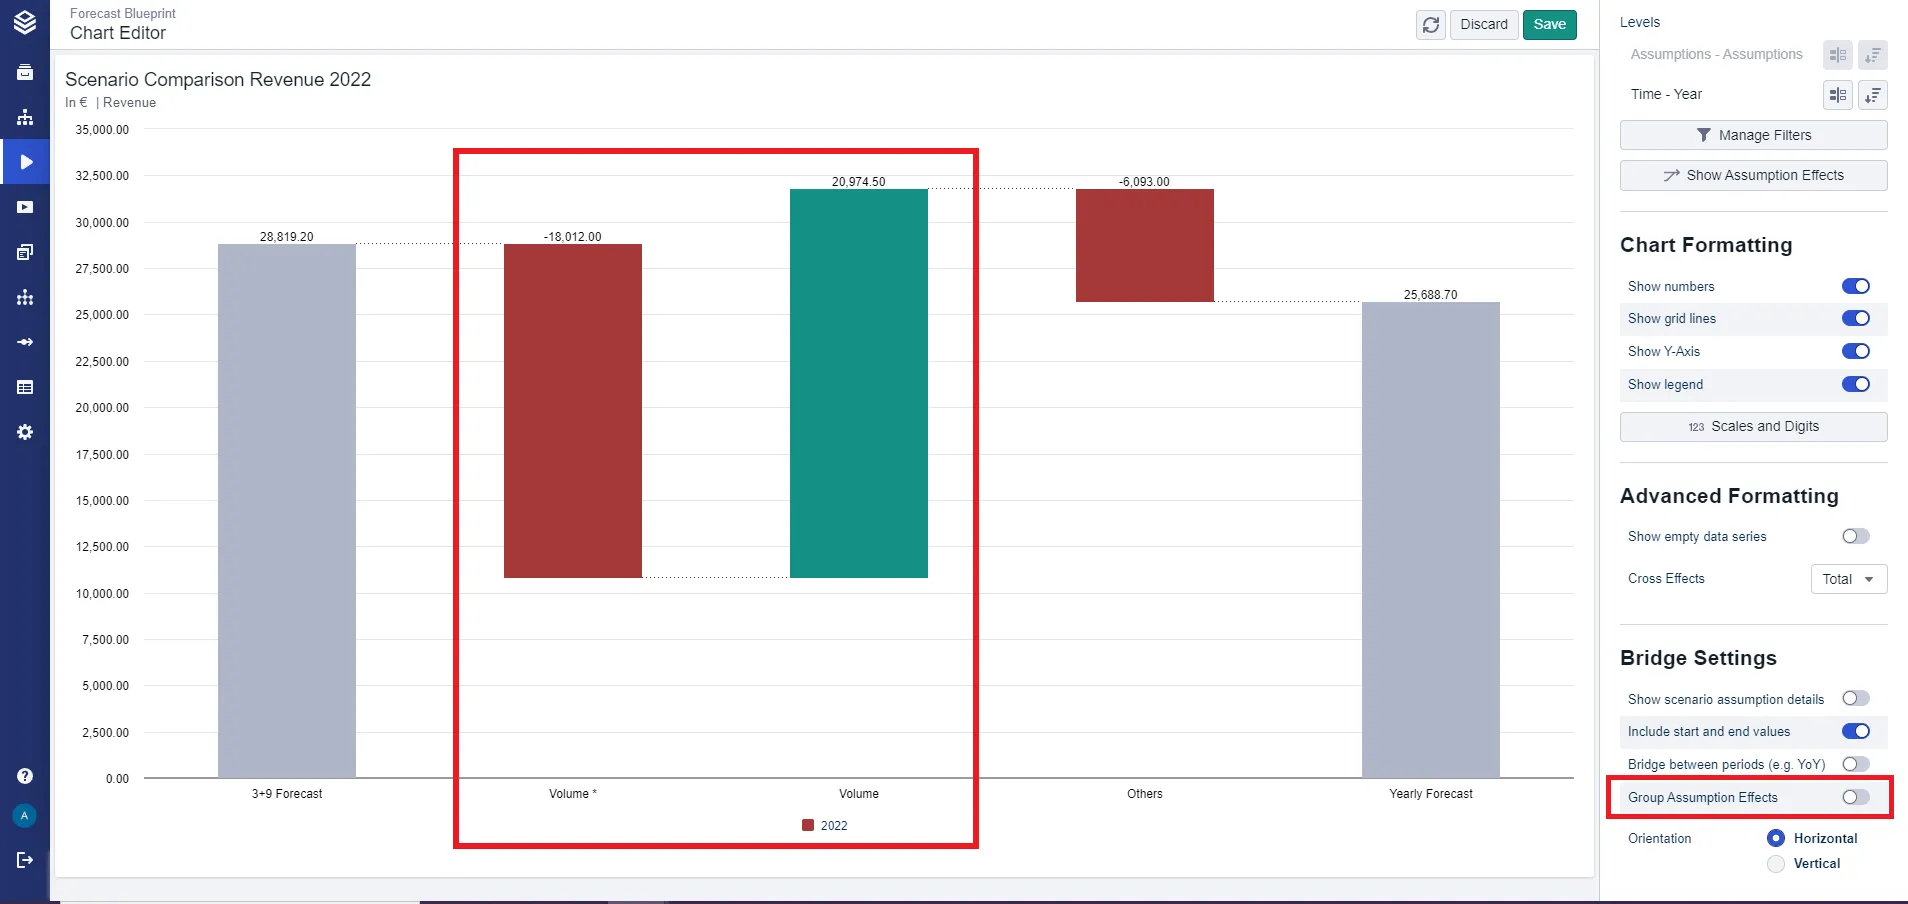
With the toggle off, this assumption contributes two separate bars, both named Volume:
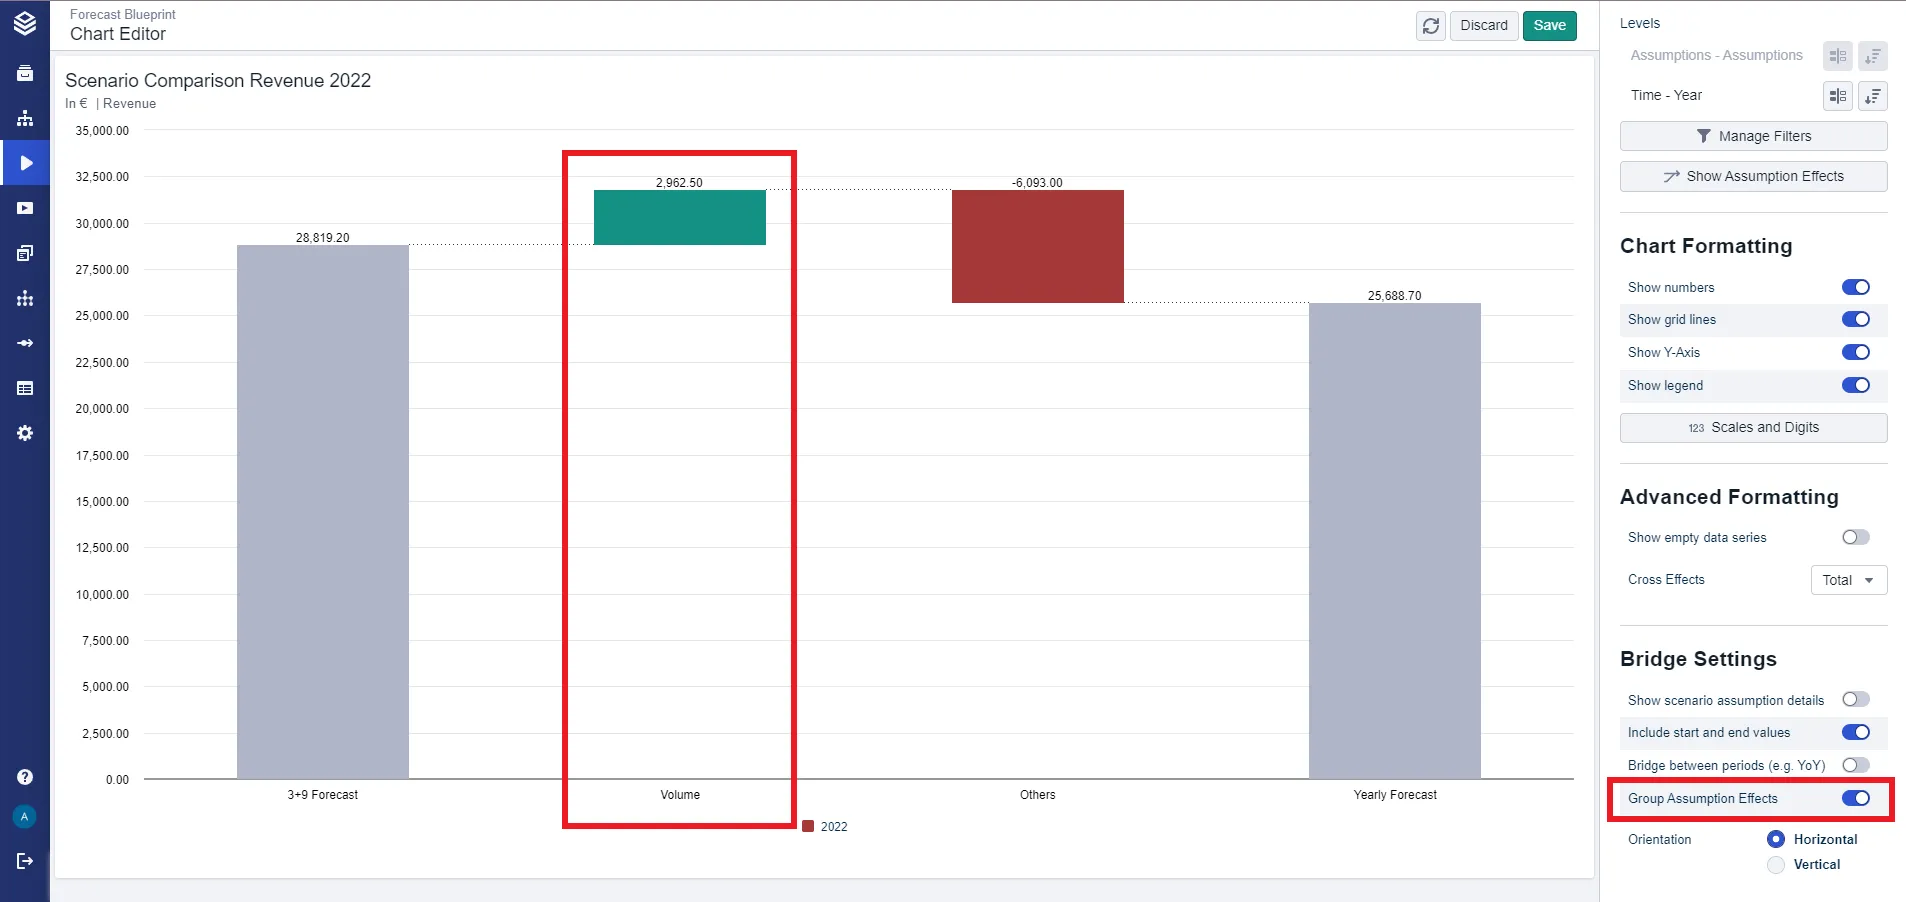
With it on, those two bars become one:
When to use it
- The bridge has become long and hard to read, and the individual line-items are more detail than the audience needs.
- You want the chart to speak in terms of assumptions rather than in terms of how those assumptions happen to be built.
- A line-item has several variants and you want the assumption’s total effect rather than one bar per variant.
Leave it off when the point of the chart is which specific line-item moved the number.
Configuration
- Select the bridge. The chart editor opens on the right.
- Go to Bridge Settings.
- Switch Group Assumption Effects on or off.
Good to know
- It groups variants too. When a bridge shows line-items with differing variants as deltas, rather than assumptions, the setting combines those variants into a single bar as well.
- It is a display setting. Grouping changes how the effects are drawn, never how they are calculated. See Assumption Effects.
- It applies to both bridge types. Scenario and time bridges both carry the toggle.
Related
- Assumption Effects: how the effect of an individual assumption is derived.
- Scenario Bridges: explain a difference between scenarios.
- Time Bridges: explain a difference between periods.
- Data Effects Display in Bridge: the equivalent grouping for the model’s own contribution.