Table Formatting
Beyond the values it shows, a table has a style, column widths and merged header cells. The first two are set directly, the third follows from the order of the levels.
What it is
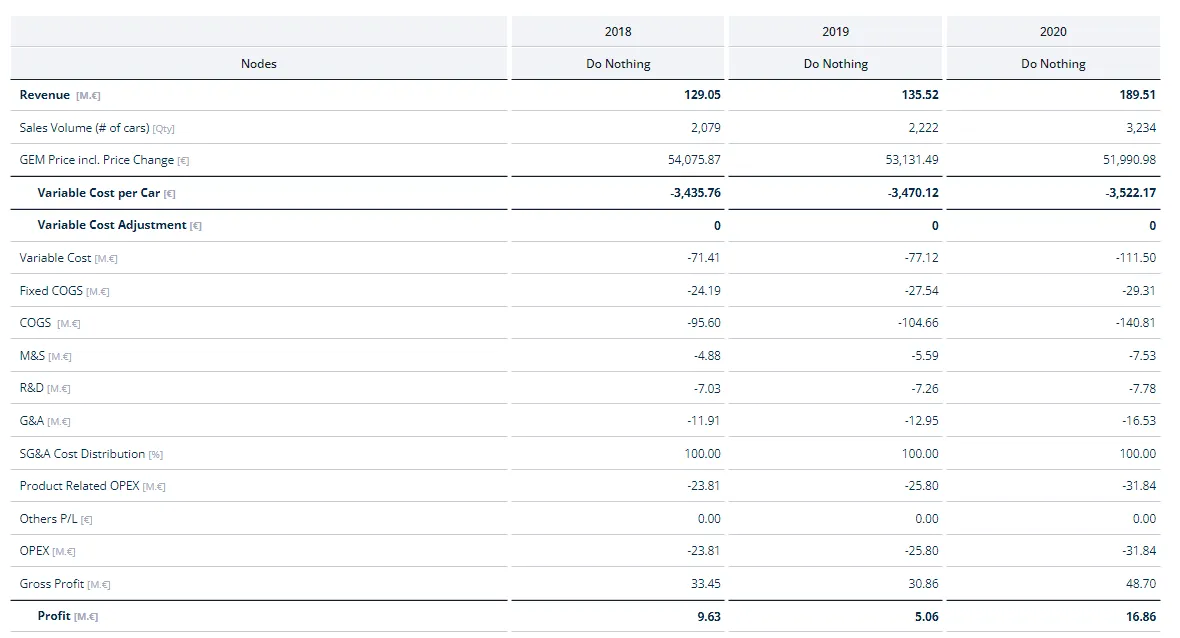
Tables use the Modern table style by default. Switching to Classic changes the look, and the setting also applies to older tables.
Columns resize automatically to the best width for the current window. Cells in the table header, or down the left side, are merged where possible.
When to use it
- A column is too narrow to read and you want to widen it for good.
- The header repeats a value on every column and you want it merged into one cell.
- An older table looks different from the rest and should match them.
Configuration
Style and column widths:
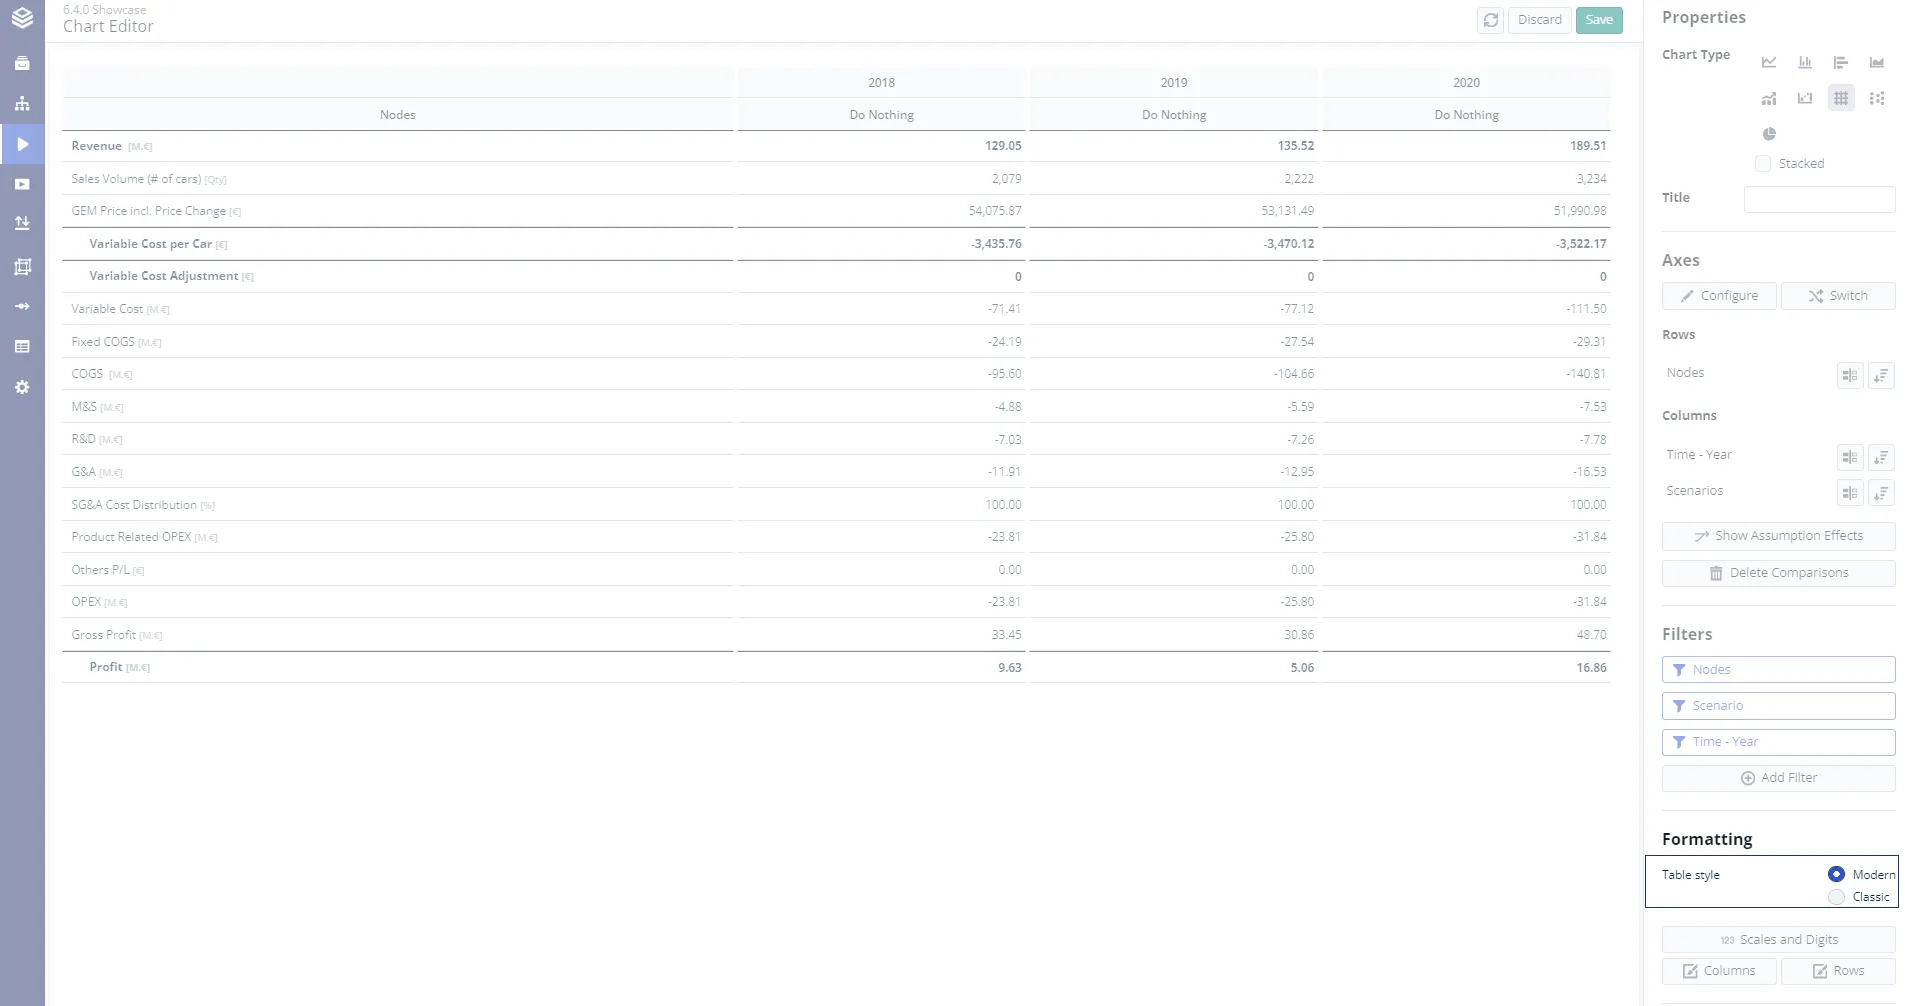
- Select the table. In the Formatting section of the chart editor, set Table style to Modern or Classic.
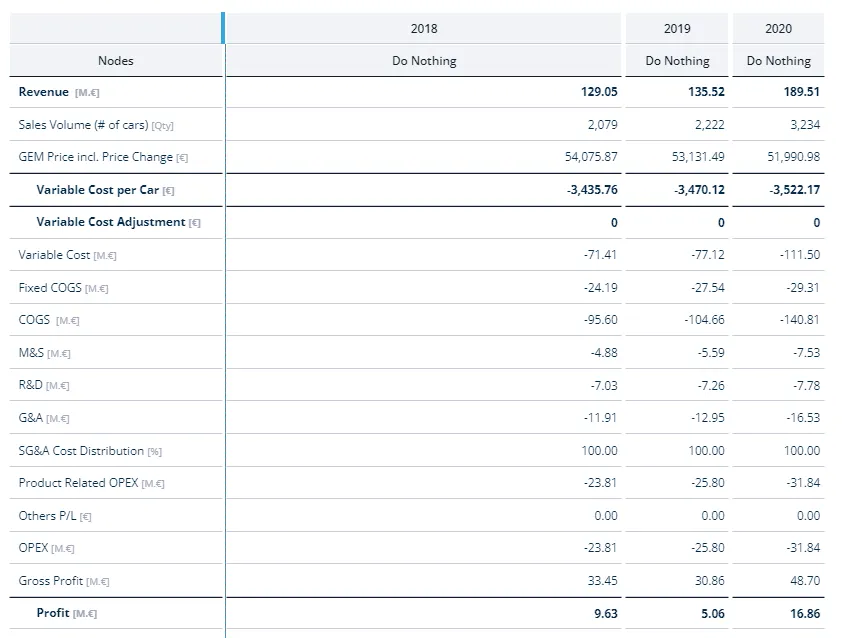
- Drag a column border to resize that column by hand. The width is saved.
- Double-click a border to reset that column to its initial width, or use Reset Column Widths to reset all of them.
- Switch on Freeze header columns, in the Advanced Formatting section, to keep the row-header columns in place while a wide table scrolls sideways.
Merged cells:
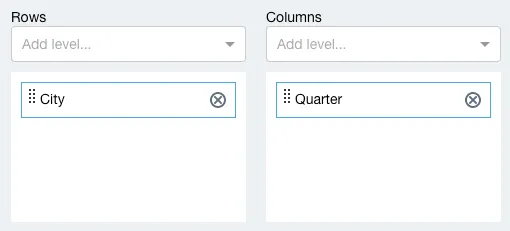
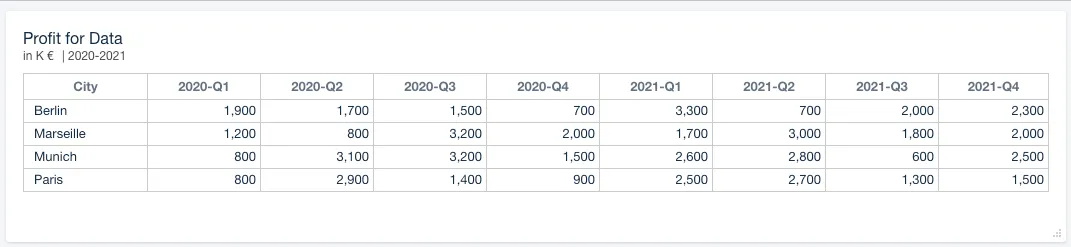
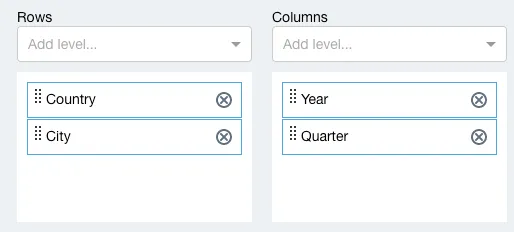
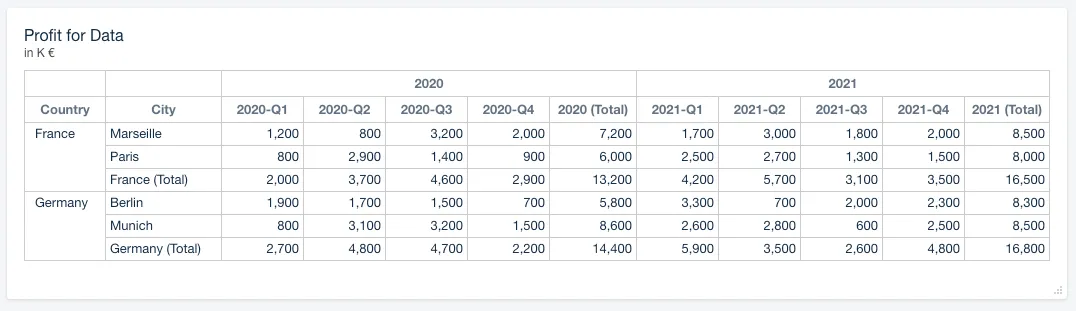
Which cells merge depends on the order of the levels, so place them in the intended order in the Configure Axes dialog. In the example below, Country is placed above City and Year above Quarter, which displays the upper levels as merged cells and adds columns with totals.
| Configure Axes | Table |
|---|---|
 |  |
 |  |
Good to know
- Levels have to belong to the same dimension to be merged. The example uses the dimension Location with the levels Country and City, and the dimension Time with Year and Quarter.
- A hand-set column width sticks. Automatic sizing stops applying to that column until you double-click its border to reset it.
- A very wide table shows a warning instead of its data. Above the column limit, 120 by default, the table renders a callout naming the limit and the number of columns rather than the data itself. Reduce the columns with filters or a coarser level, or ask an administrator to raise the limit. See Limitations & Data Sizing Guidelines.
- Row formats are set elsewhere. Subtotals, totals and indentation live in the Style Columns and Rows dialog: see Styling Data Series, Columns and Rows.
Related
- Styling Data Series, Columns and Rows: subtotal and total formats, indentation, colors.
- Sorting Level Values: the order the rows and columns appear in.
- Data Display in Charts and Tables: which data a table shows, and at which aggregation.