Model Tree
A model tree draws the nodes of the underlying model as a graph on the worksheet, so you can show how a figure is arrived at rather than only what it is. In the chart type selection it is called Tree, under Others.
What it is
Each node is drawn as a box: its name and unit in the header, then one row per period with the value. Connectors show which nodes feed which, so the chain from the drivers to the top figure is visible. Values can be shown for several scenarios at once.
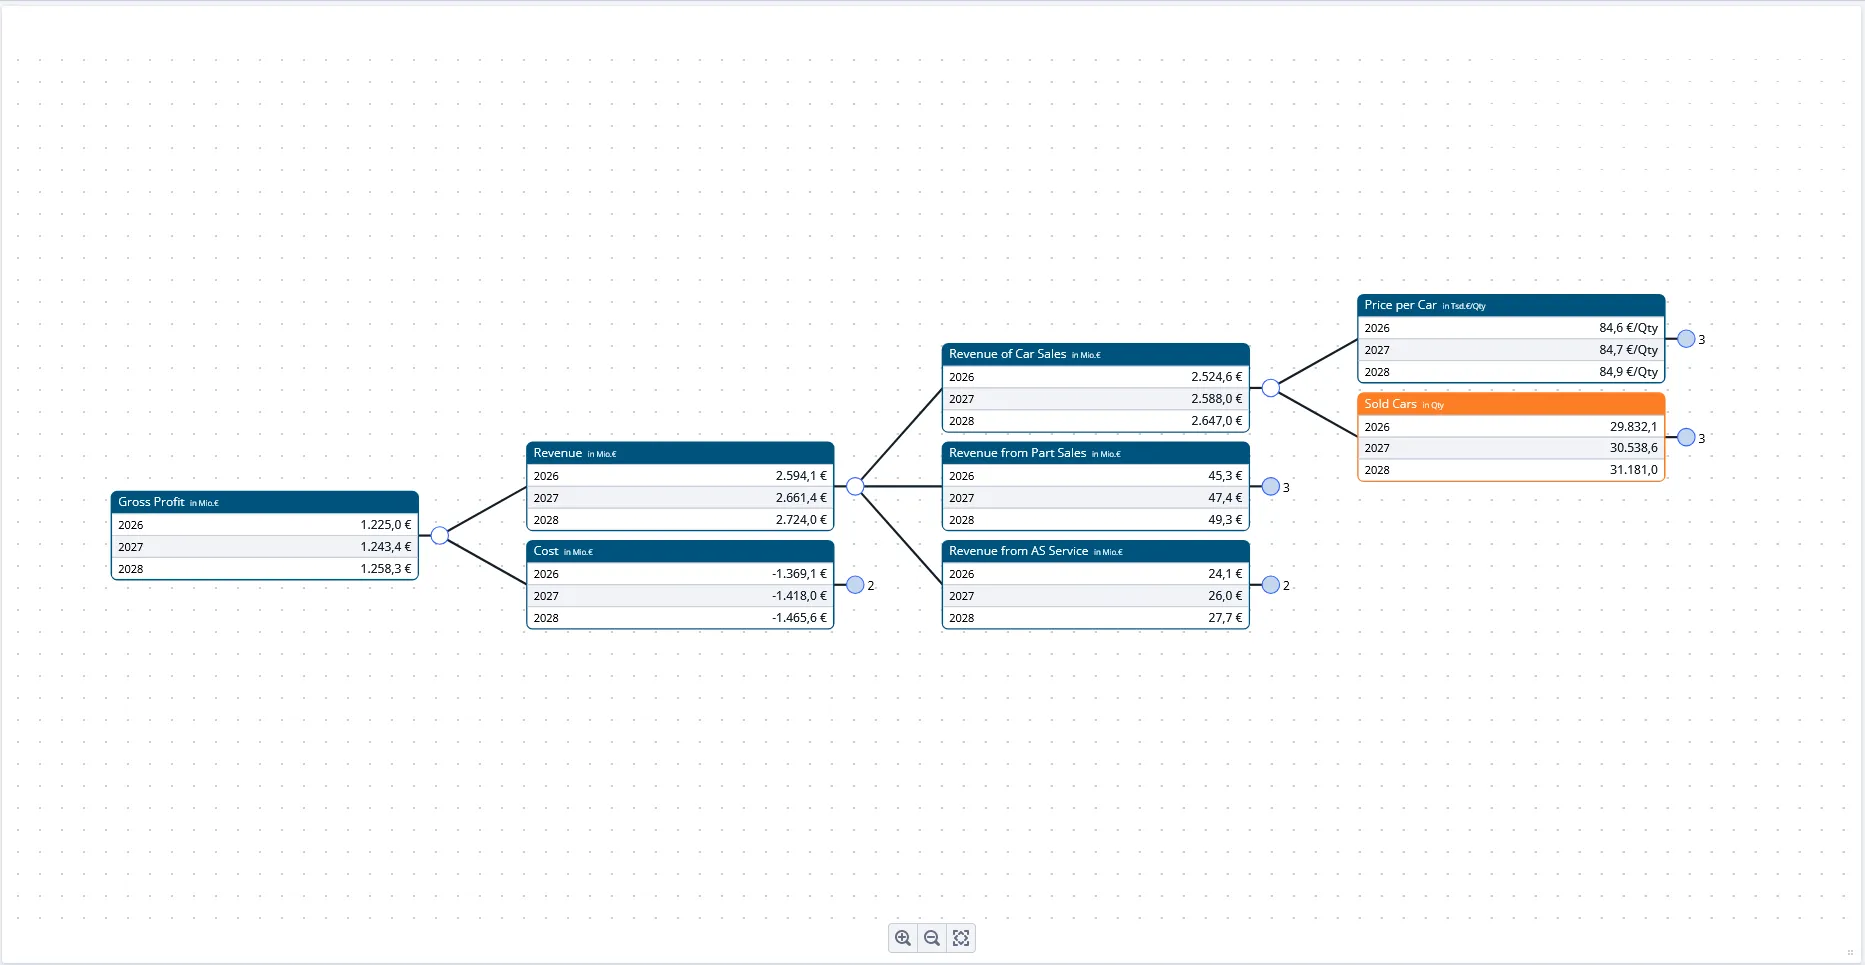
The tree is a view of the model, not a separate drawing. It follows the model’s structure, so it changes when the model changes.
When to use it
- You want to explain the cause and effect behind a number, not just present the number.
- You are walking an audience through a model for the first time.
- You want to show where an assumption enters the calculation.
Use a bridge instead when the question is why two values differ, and a waterfall when you want a build-up rather than the whole structure.
Configuration
Much of what a model tree looks like comes from the nodes themselves, in the model editor. The chart editor adds a Tree Settings section of its own, which applies to that one chart:
| Setting | Where it lives | What it does |
|---|---|---|
| Default Scale | Node advanced settings | Sets the scale a node’s numbers are shown at, in every chart including the tree. See Default Scale Settings in Nodes. |
| Sort key | Node advanced settings | Sets the order the nodes appear in. See Sort Key Settings in Nodes. |
| Hide in workspace | Node advanced settings | Excludes a node from model tree charts. See Advanced Node Settings. |
| Hide technical Nodes | Workspace setting | Overrides hide in workspace for the whole workspace. |
| Show key figures | Chart editor, Tree Settings | Shows or hides the key figures inside each node box. |
| Show aggregation type | Chart editor, Tree Settings | Shows or hides each node’s aggregation type in the node box. |
| Hide empty nodes | Chart editor, Tree Settings | Leaves nodes that carry no values out of this chart. |
| Show assumption influence | Chart editor, Tree Settings | Marks the nodes an active assumption feeds into. |
The four Tree Settings toggles sit in the chart editor and only affect the chart you are editing. The node settings above them affect every chart the node appears in.
Good to know
- A node hidden in the workspace will not appear. Nodes marked hide in workspace are left out of model tree charts by default. Switch Hide technical Nodes off for the workspace to bring them back. This is not the same control as Hide empty nodes, which is a chart setting and drops nodes that have no values rather than nodes marked technical.
- Hiding or coloring connectors does not carry over. Those node settings affect the model editor, not the tree chart on a worksheet.
- Unformatted large numbers are a node setting, not a chart setting. A tree puts nodes of very different magnitudes side by side, and the chart’s own scale applies to all of them at once, so raising it rounds the small values to zero. Set each node’s Default Scale instead.
- Nodes with no sort key sort by name. That is why costs sort above revenue. Give the nodes sort keys to set a deliberate order, and note that the ordering runs among siblings rather than across the whole tree.
Related
- Sort Key Settings in Nodes: controlling the order nodes appear in.
- Default Scale Settings in Nodes: scaling a node’s numbers, in the tree and in every other chart.
- Advanced Node Settings: the other node settings, including hide in workspace.
- Chart Types: the other chart types and tiles.