Part 4: Build the Driver Model
In this part, you create two models and build the cause-effect relations of the revenue model.
Models in Valsight define the underlying calculation logic that connects data, business logic, and drivers as the basis for scenario simulation.
For detailed reference on any of the concepts here, see Modeling.
Watch the video guide
The model structure
Driver models in Valsight follow the “Valsight Fish” structure, read from right to left.
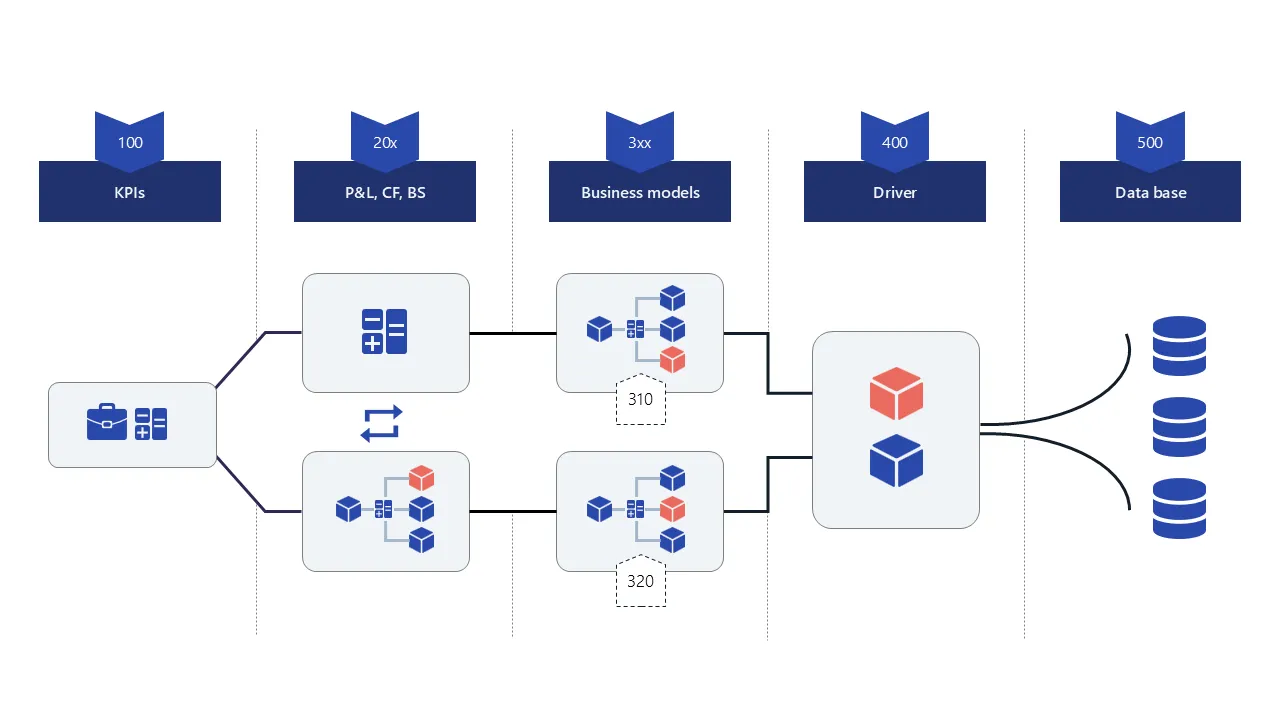
For this tutorial, you will create two models:
- 500_Data: contains the base nodes that pull in the Excel data
- 100_P&L: contains the drivers, calculation logic, and the revenue result
Steps
Create the models
- Open the Model overview from the left menu bar.
- Click Add to create the two models:
Field 500_Data100_P&LDescription Base data from Excel Revenue calculation and drivers Submodels None 500_Data- Click Create.
Build the
500_DatamodelThe data model contains two base nodes that connect to the uploaded Excel data: one for volume and one for price.
- Open the 500_Data submodel by clicking its name.
- Click the Node button in the action bar at the bottom of the canvas.
- Create two Data nodes:
Node Unit Volume (Base)QuantityPrice (Base)EUR / Quantity- Select a node, click the Data button in the function editor, choose Data source, Table and Measure in the dialog, then click Insert to connect it via the DATA function:
Node Formula Volume (Base)DATA("TutorialData", "Price and Volume", "Volume")Price (Base)DATA("TutorialData", "Price and Volume", "Price")Use Data Preview to confirm that both nodes show 2025 values.
Build the 100_P&L model
Switch to 100_P&L using the model selector in the header at the top left of the Model Editor. Create the following nodes:
Node Type Unit VolumeStandard QuantityMarket GrowthSimulation PercentPriceStandard EUR / QuantityPrice AdjustmentSimulation EURRevenueStandard EURThen set each node’s formula:
Node Formula VolumeROLLFORWARD_ADVANCED('Volume (Base)', 'Market Growth')Market GrowthEXPAND(0, "Year", "Region")PriceROLLFORWARD_ADVANCED('Price (Base)', 'Price Adjustment')Price AdjustmentEXPAND(0, "Year", "Product", "Country")Revenue'Volume' * 'Price'ROLLFORWARD_ADVANCED carries the 2025 base values forward into future years; EXPAND creates a dimensional structure for an empty node.
Price Adjustmentmust match the dimensions ofPrice (Base).Use Data Preview to confirm that Revenue equals Volume times Price.
Result
- Created two models:
500_Dataand100_P&L - Connected Excel data with DATA
- Used ROLLFORWARD_ADVANCED to project values forward
- Created simulatable drivers with EXPAND
- Calculated Revenue as Volume times Price