Sorting Level Values
The level values of a chart or table are the rows of a table and the entries along the x axis of a chart. They can be put in any order you want, one chart at a time.
What it is
By default level values follow the order they have in the model. Sorting is set per level, so a chart with Country and City has its own order for each of them, and it applies to that chart only.
When to use it
- The default order does not match how your audience reads the figures, for example when a scenario should come last.
- Rows need to follow the structure of a statement rather than the structure of the model.
- Labels are disappearing where they collide, and the order decides which one wins.
To change the order nodes appear in within a model tree rather than in one chart, set their sort keys instead: see Sort Key Settings in Nodes.
Configuration
-
Select the chart or table. The chart editor opens on the right.
-
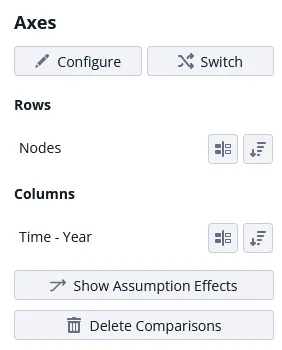
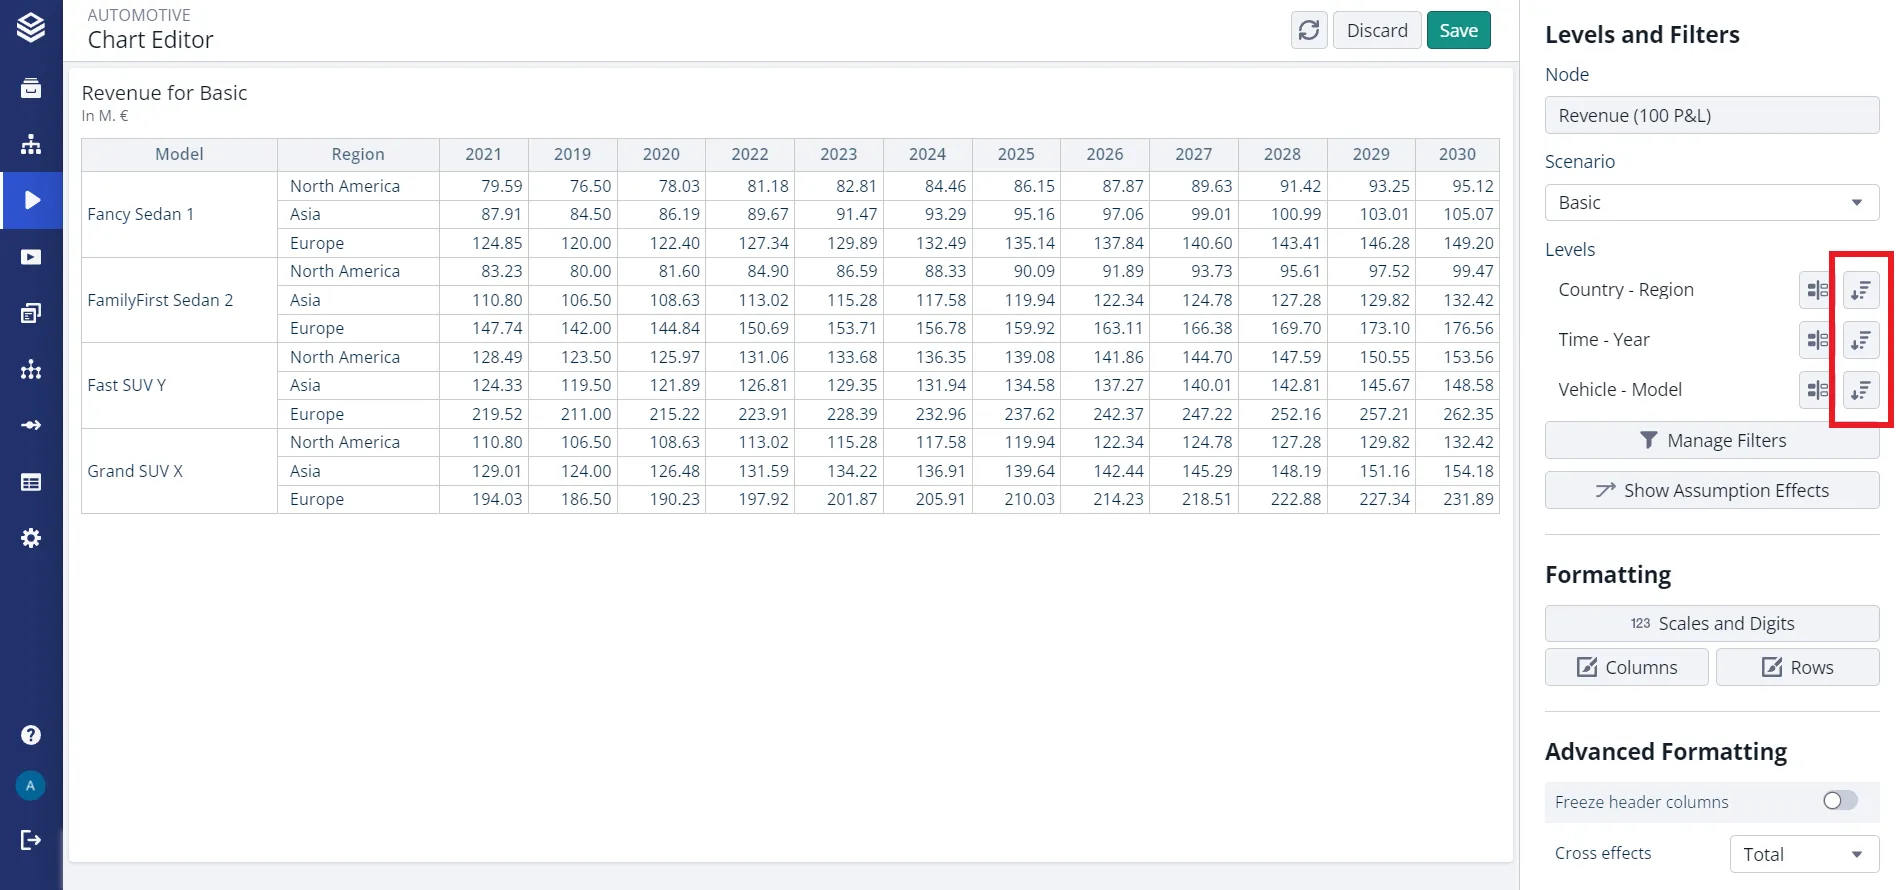
In the Axes section, click the sort button next to the level you want to reorder. The levels are grouped under headings named after the chart: Rows and Columns for a table, X-Axis and Data Series for most charts.
-
Choose a sort mode:
Mode What it does Alphabetical - ascending Orders the level values by name, A to Z. Alphabetical - descending Orders them by name, Z to A. Manual Lets you drag the level values into any order you want. By value - ascending Orders them by a value you pick, smallest first. By value - descending Orders them by that value, largest first. -
For either By value mode, pick the reference under Value to sort by. The list holds the values on the opposing axis. Leaving it empty is rejected with “You need to select a value for value based sort.”
-
Confirm.
Good to know
- Sorting here sorts one chart. The model is untouched, and other charts keep their own order. For a model-wide order, use Sort Key Settings in Nodes.
- Sorting by value is not always offered. Where it is unavailable the dialog shows the three other modes only. Values on time bridges cannot be sorted, and neither can values carrying the delta setting.
- Order decides which data label wins. In area and line charts, where labels collide the higher-sorted node’s label is the one shown. See Overlapping Data Labels.
- Order and formatting are separate. Subtotal and total formats sit in the styling dialog: see Styling Data Series, Columns and Rows.
Related
- Sort Key Settings in Nodes: the order nodes have in a model tree.
- Styling Data Series, Columns and Rows: colors, value labels and subtotal formats.